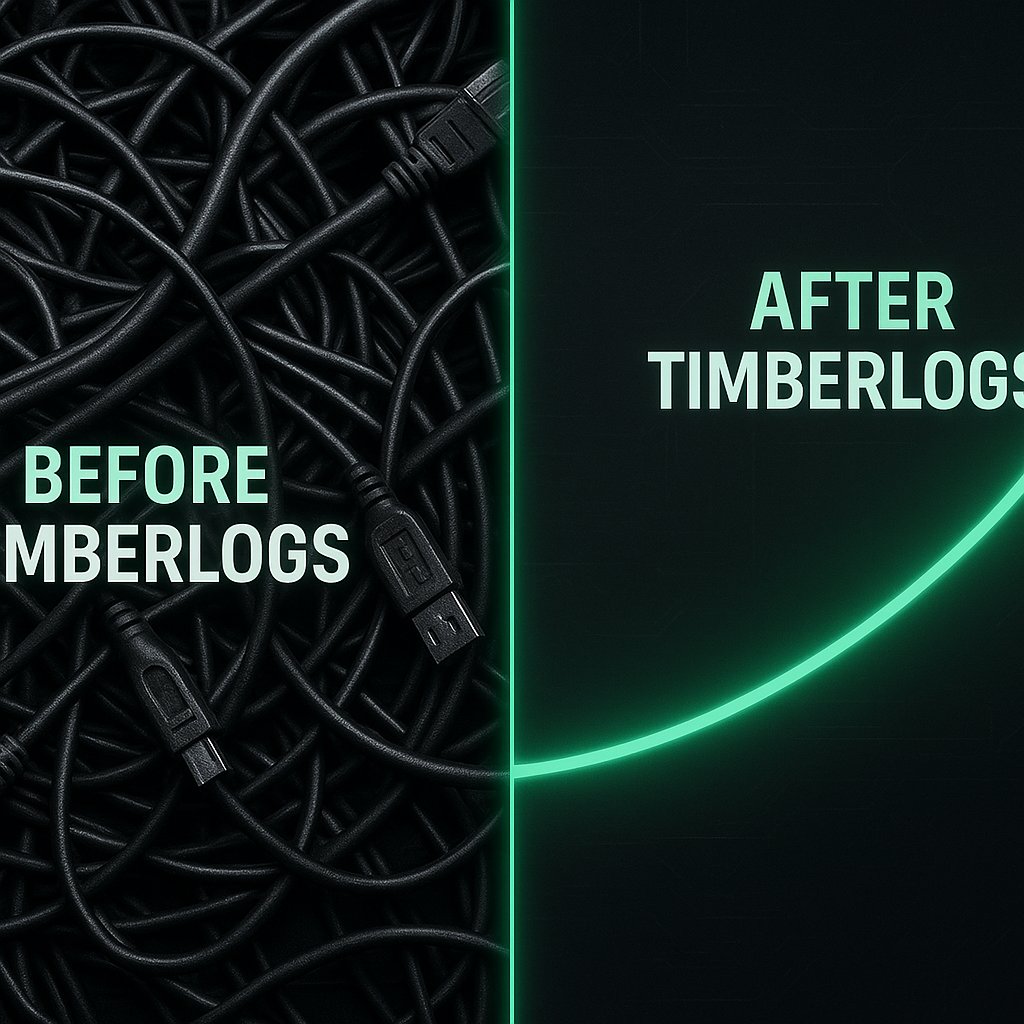
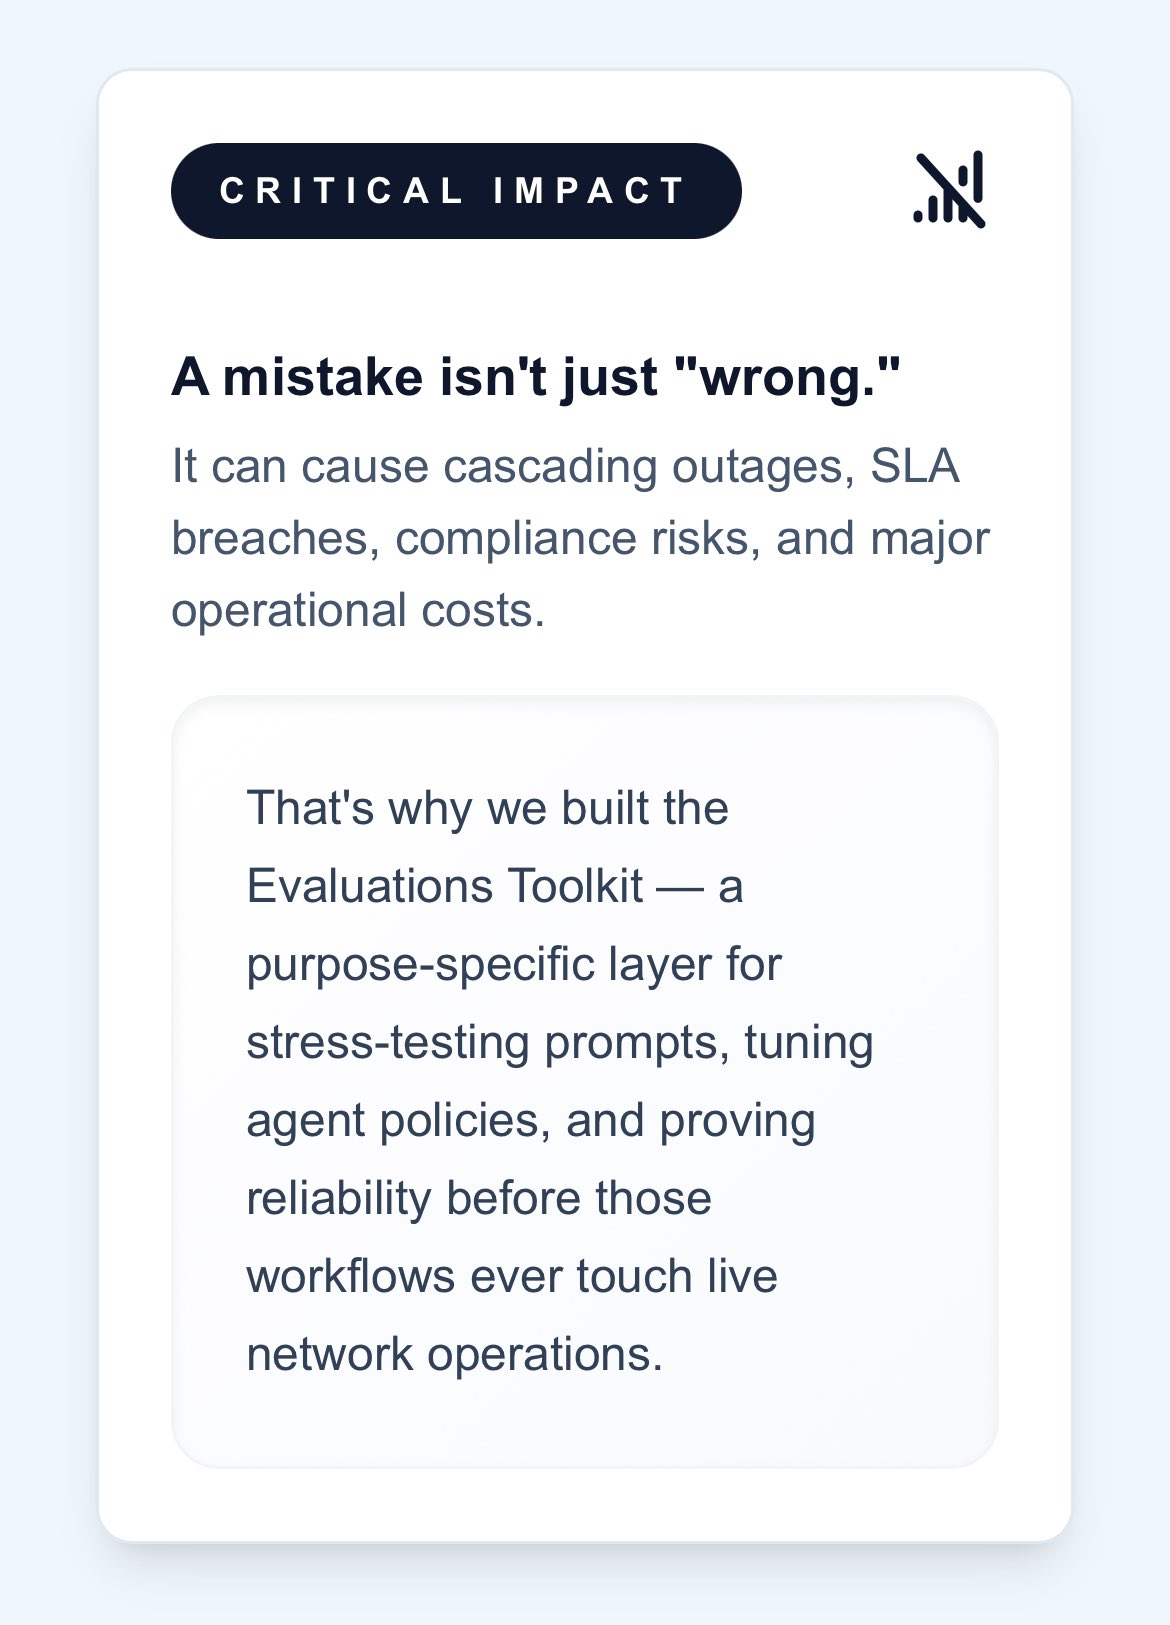
Worten Dev Rio
Worten Dev Rio @cryptorcalls ·
therapist: the infinite agent loop isn’t real, it can’t hurt you your terminal at 3am: tool call → error → retry → “as an ai agent…” → tool call → error → retry → you don’t need agi, you need a pause button and a state inspector ☀️ #ai #agents #observability
5
Kubernetes with Naveen 🇮🇳
Kubernetes with Naveen 🇮🇳 @NaveenS16 ·
Making #Kubernetes invisible is the ultimate platform goal, but the reality is still a grind. While K8s is the powerhouse for #AI, the barrier to entry is still a wall. Most teams nail Day 1 (install) but get crushed by Day 2 ops: security, #observability, networking at scale.
115
今日も監視くん
今日も監視くん @kanshi_sre ·
ルータのポートを閉じて、 ネットワーク断を再現してみました。 内部監視はOKのまま、 外形監視だけNG。 「サーバは正常。でも使えない」 状態ってこういうことなんだなと実感。 内と外、両方見る意味が腹落ちしました。 #SRE #Observability #監視
今日も監視くん 今日も監視くん @kanshi_sre ·
AWSのEC2上に監視拠点を作って 外形監視にチャレンジしてみました。 サーバが「動いているか」ではなく ユーザーから「使えるか」を見る。 内(自宅)と外(AWS) 両面から監視することで 見えるものが変わってきます。 まずはシンプルに ダッシュボードも内外で分離。 #SRE #監視 #Observability
134
TechDay Australia
TechDay Australia @techday_au ·
New Relic has been named a Leader again in IDC's Worldwide AIOps 2026 MarketScape, marking its third consecutive Leader ranking. The recognition highlights its AI-led observability tools. #AIOps #Observability #AI #IDCMarketScape techday.com.au/story/new-reli…
New Relic named IDC MarketScape AIOps leader again

New Relic secures a third consecutive Leader ranking in IDC's Worldwide AIOps 2026 assessment, highlighting its AI-led observability tools.
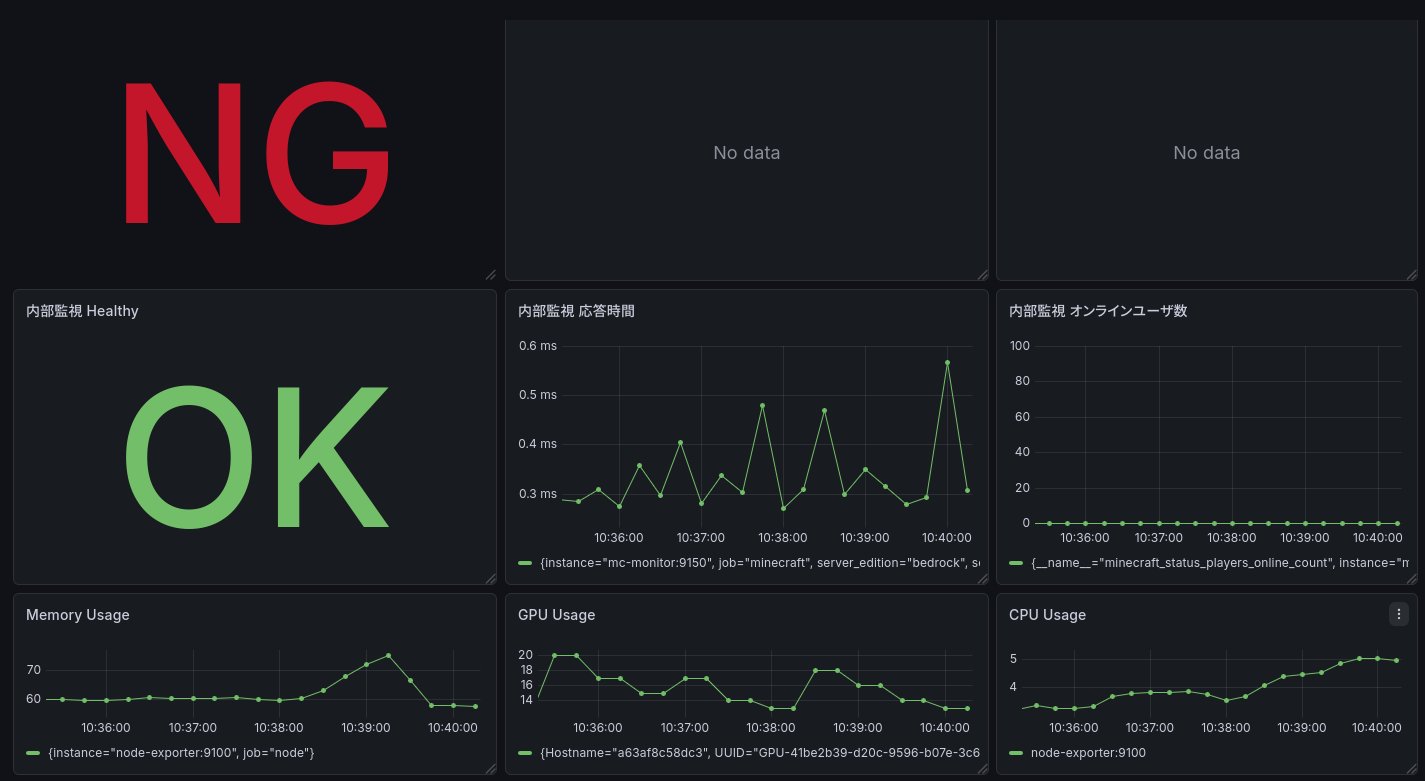
From channellife.com.au
23
今日も監視くん
今日も監視くん @kanshi_sre ·
Qiitaに投稿しました。 サーバは正常。でも使えない。 内部監視だけでは見えなかったことが、 外形監視で見えるようになりました。 AWSに監視拠点を置いて、 「使えるか」を見る構成を作ってみました。 qiita.com/KanshiKun/item… #SRE #Observability #Prometheus
【Observabilityへの道シリーズ⑥】サーバは正常。でも使えない?外形監視で見えた違い - Qiita

はじめに 前回の記事で、アラートルールを定義しました。どの状態を障害とするのか。どのタイミングで通知するのか。これで「監視としては完成した」と言えます。 ただ、運用しているとこう感じることがあります。 👉 サーバは正常。でも使えない。 内部のメトリクスは問題ない。アラート...

From qiita.com
59
TechDay Australia
TechDay Australia @techday_au ·
Dubber has cut observability run costs by 25% after moving to Grafana Cloud, streamlining metrics, logs and monitoring across its global platform. #GrafanaCloud #Observability #CloudComputing #Monitoring techday.com.au/story/dubber-c…
Dubber cuts observability costs by 25% with Grafana Cloud

Dubber trims observability run costs by 25% after shifting to Grafana Cloud, simplifying metrics, logs and monitoring across its global platform.

From itbrief.com.au
5
今日も監視くん
今日も監視くん @kanshi_sre ·
AWSのEC2上に監視拠点を作って 外形監視にチャレンジしてみました。 サーバが「動いているか」ではなく ユーザーから「使えるか」を見る。 内(自宅)と外(AWS) 両面から監視することで 見えるものが変わってきます。 まずはシンプルに ダッシュボードも内外で分離。 #SRE #監視 #Observability
189
Maulana Kurniawan
Maulana Kurniawan @MaulanaKrniawan ·
Webhook failures rarely look like "site down." More often it's retries, missing events, or a growing dead-letter queue while uptime still looks fine. That's the gap WebhookWatch is built to catch. webhookwatch.com #webhooks #devtools #observability
Webhook Monitoring Tool – Detect Failed Stripe, Paddle & GitHub Webhooks Early

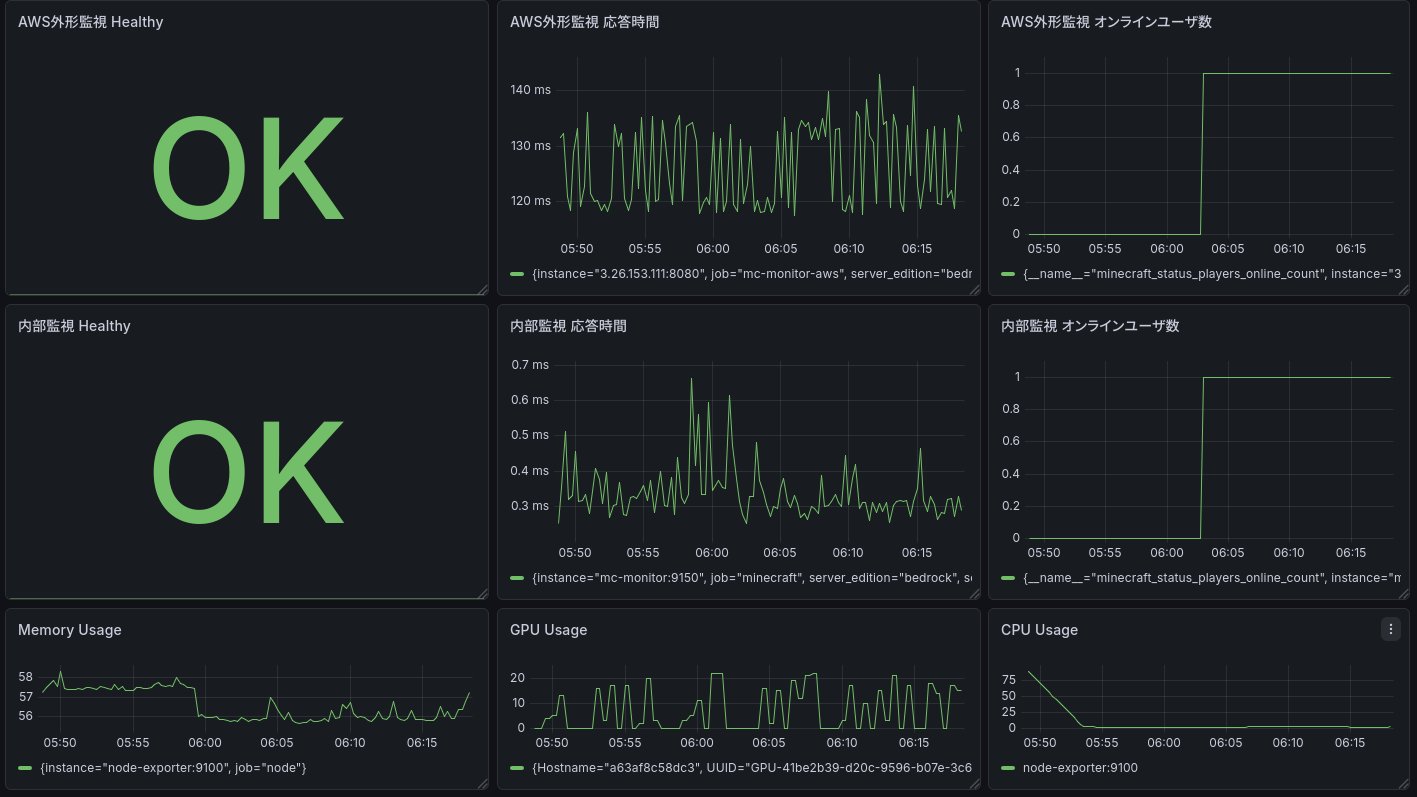
Monitor webhook endpoints by sending periodic requests and verifying response status codes. Detect failures early and track incidents for Stripe, Paddle, GitHub, or any webhook provider.

From webhookwatch.com
1
24
Vasilescu David
Vasilescu David @buildingwwdavid ·
"No traces. No logs. No alerting. That's not observability. That's hope." 300 incorrect agent outputs/day at scale — accumulating silently. Your monitoring stack wasn't built for agents that reason. #AIAgents #Observability
4
Roheet Mane
Roheet Mane @Roheet_Mane_in ·
Production rule: If you can’t detect it, you can’t fix it. If you can’t fix it fast, you don’t understand it. Observability isn’t optional — it’s your first line of defense. #DevOps #SRE #Observability #Tech
3