🎉 Big news: new Waterfall Charts are now available in Power-user!
Instantly insert stunning and insightful charts, add comments in seconds, and make your data speak louder than ever.
👉Check it out from your Library!
#WaterfallChart #Productivity #PowerPoinlC
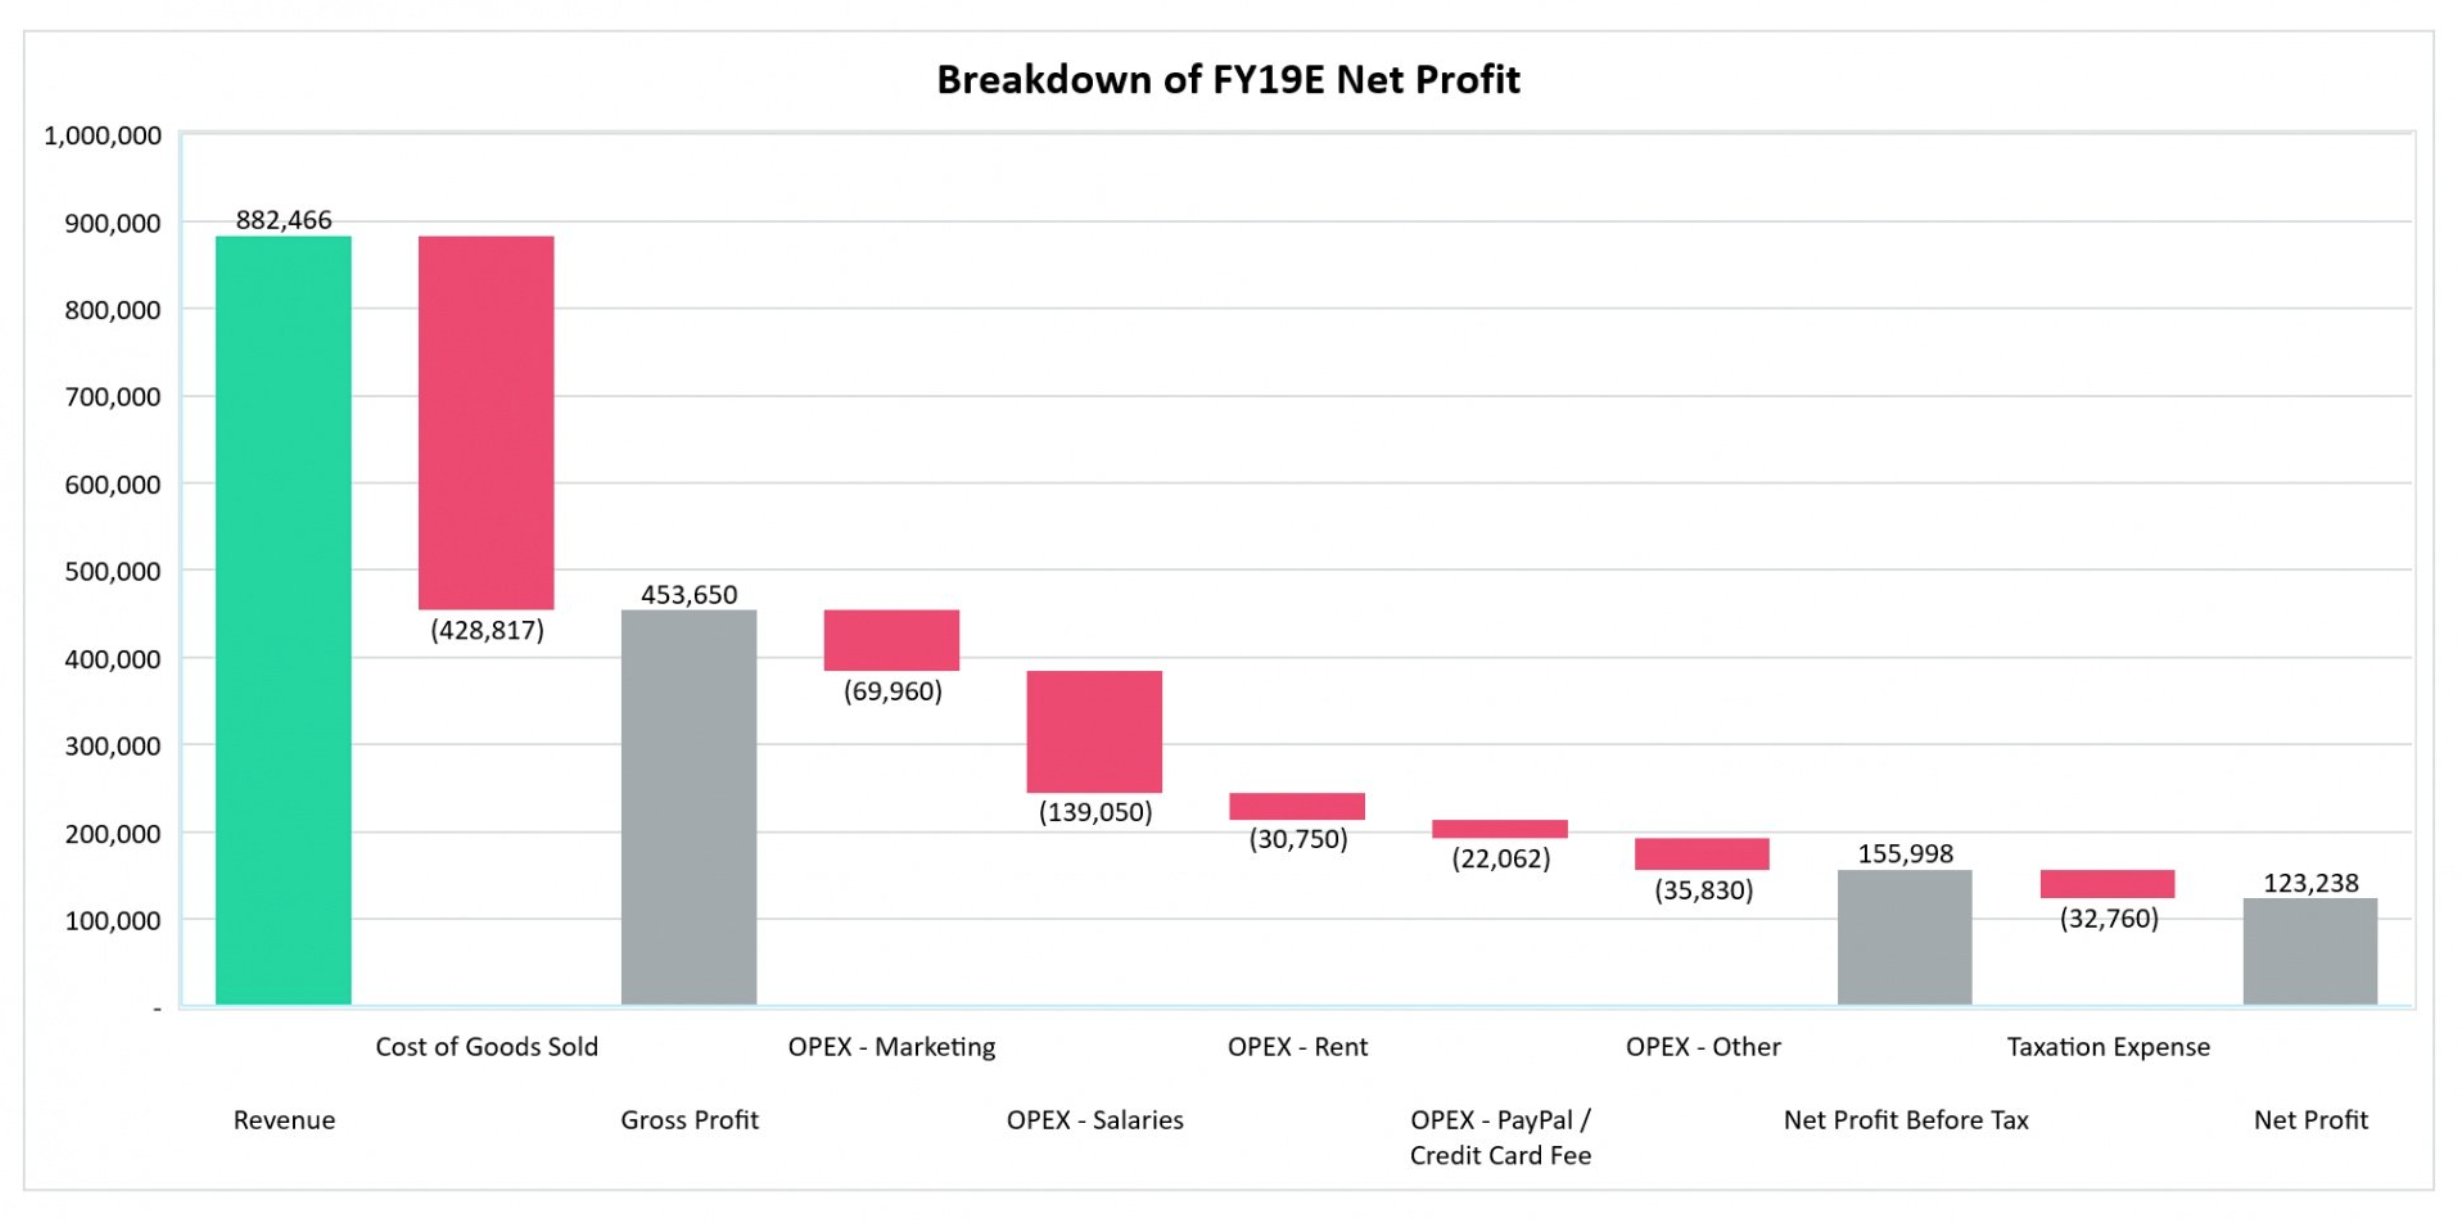
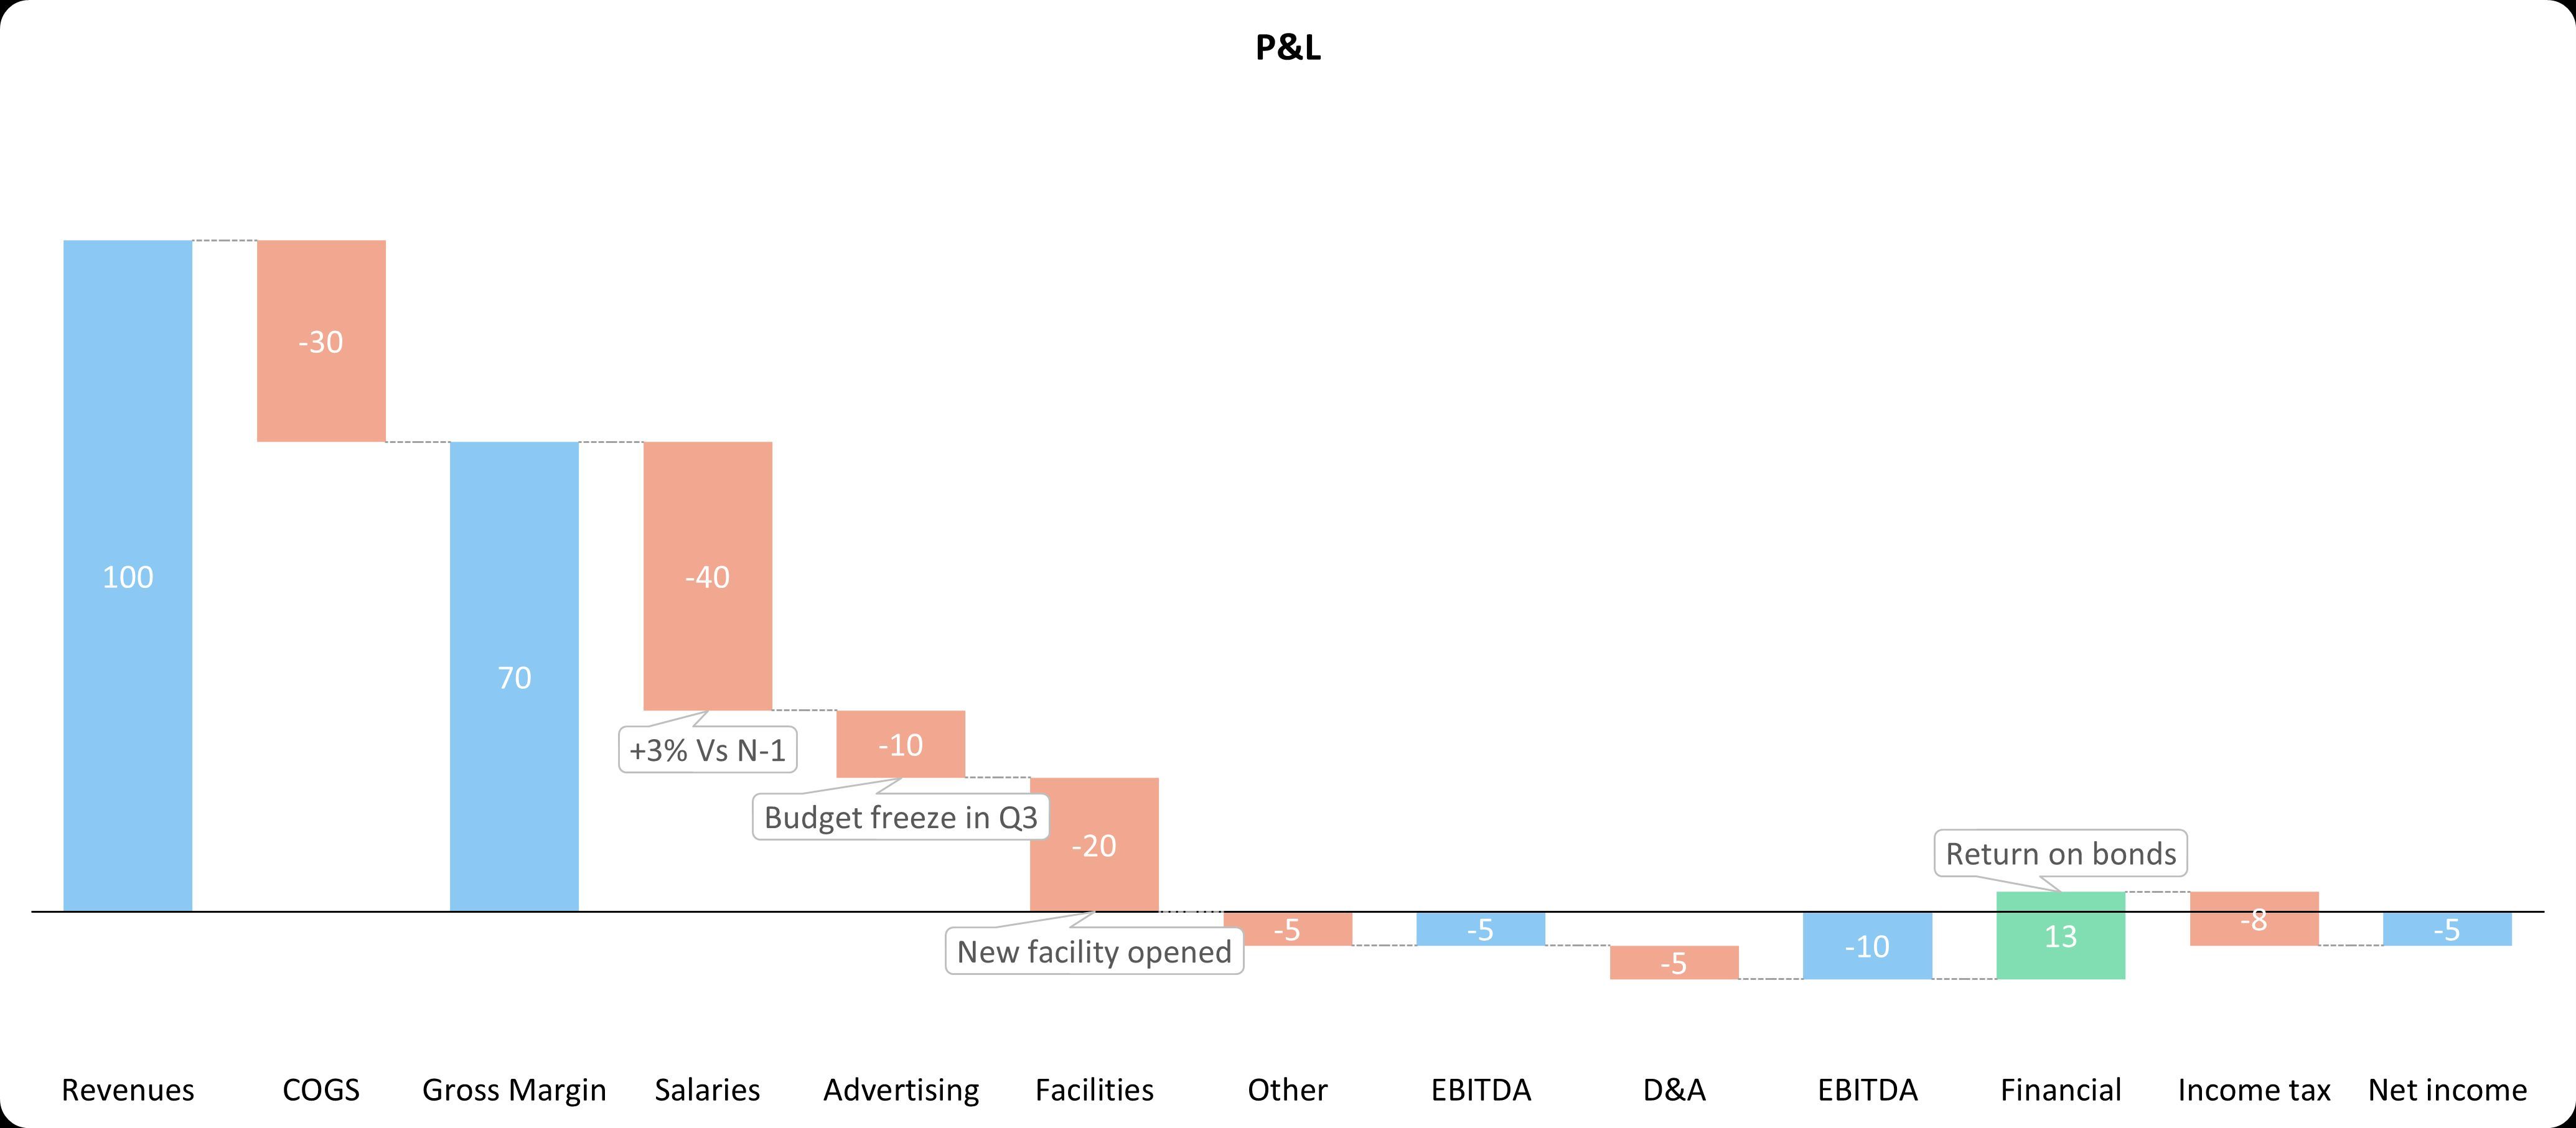
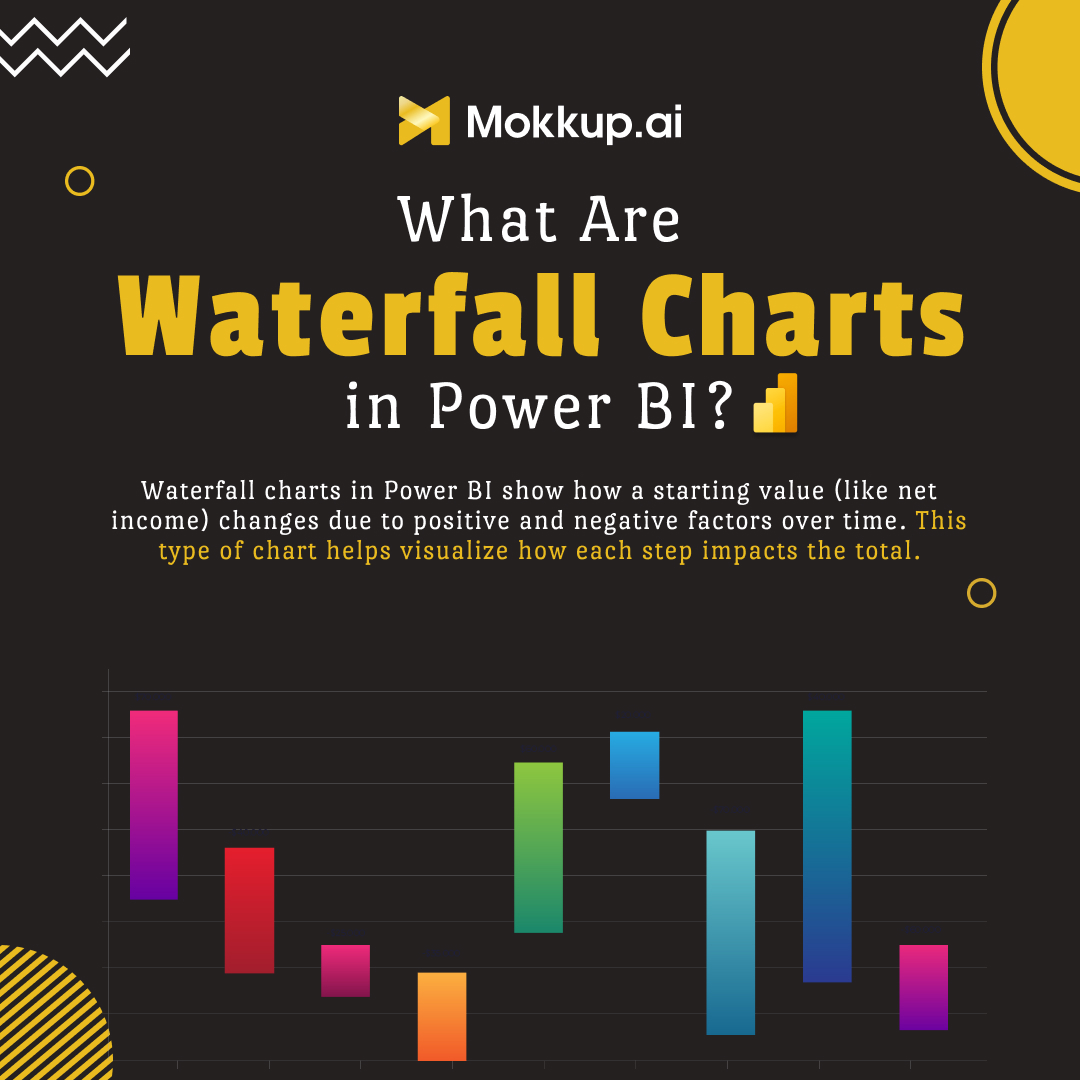
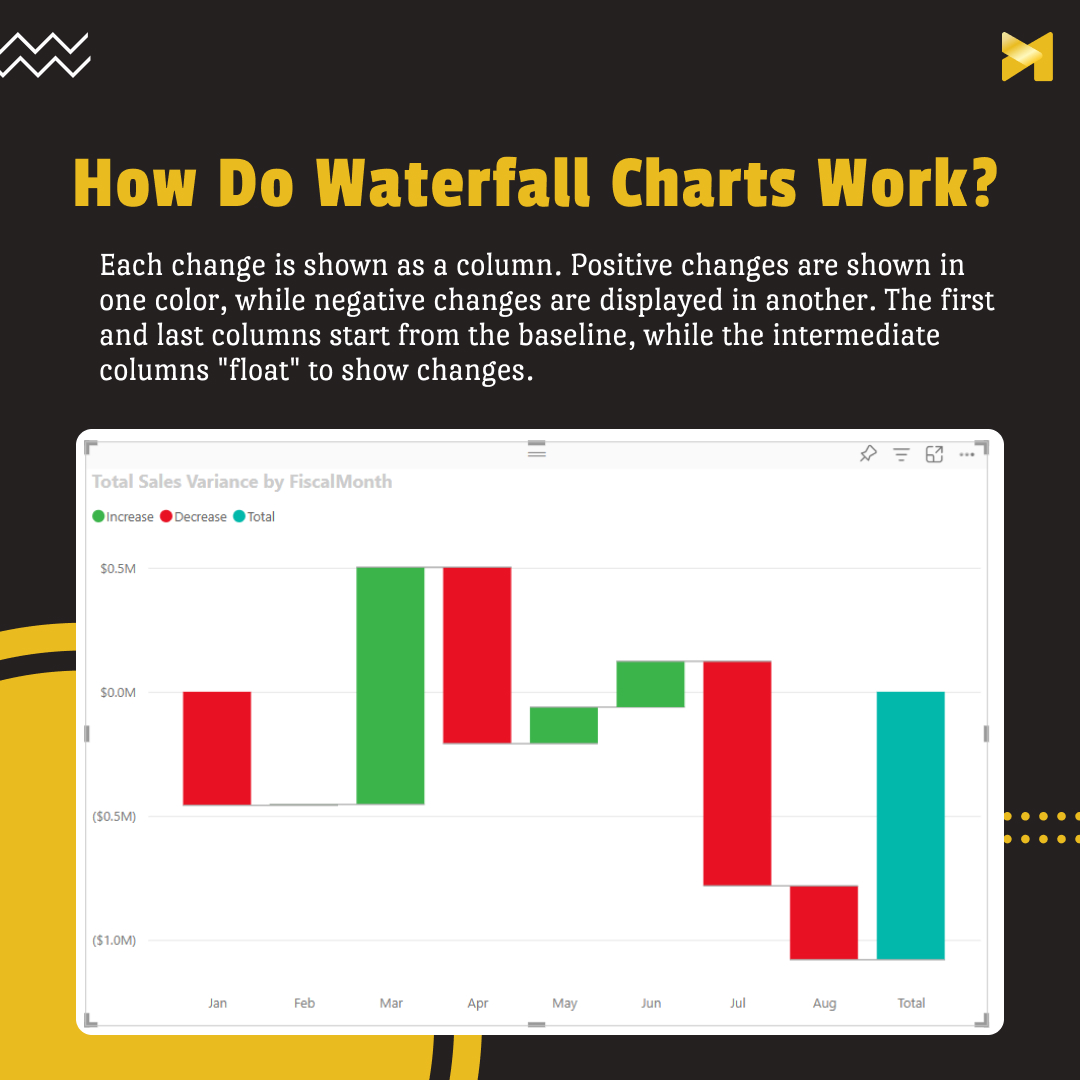
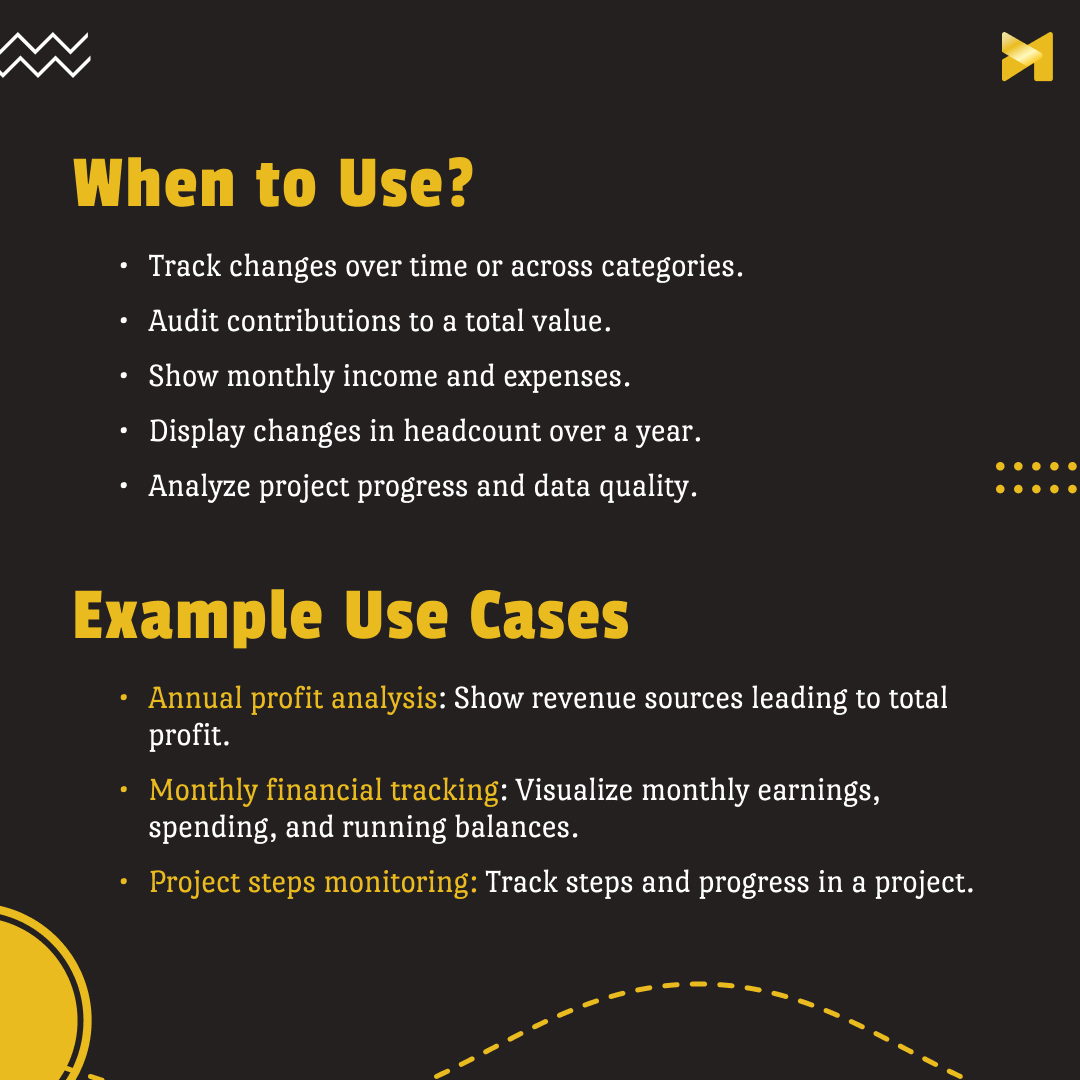
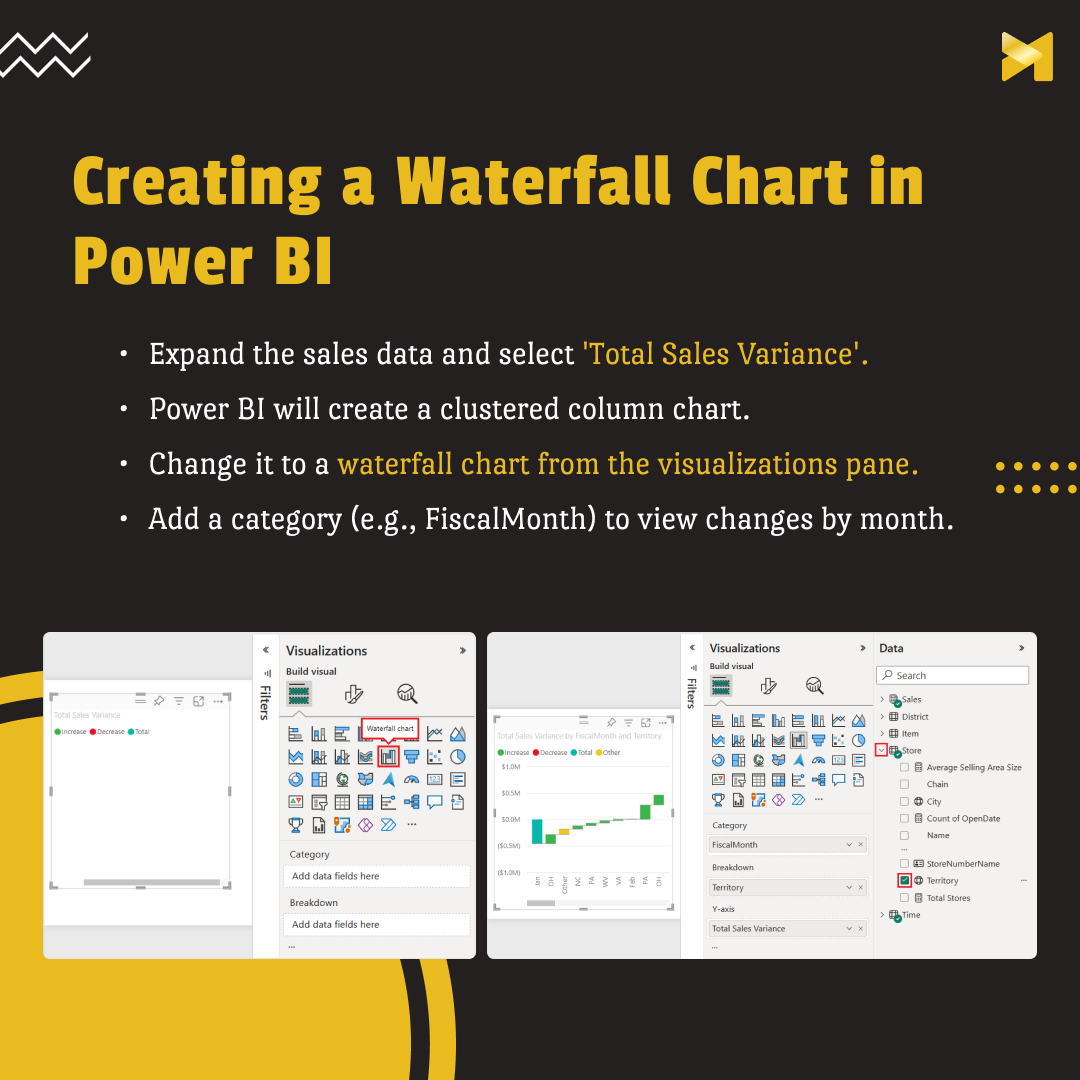
Waterfall charts in Power BI are visual tools that show a running total of changes over time, adding and subtracting values.
They are useful for illustrating changes over time, spotting trends, breaking down revenue sources and tracking headcount changes
#waterfallchart#mokkup
Salah satu kelebihan visual Waterfall chart. Teman2 bisa lihat dan bandingkan di video berikut. Dapatkah...? Perhatikan untuk Argentina.
#waterfallchart#dataviz#powerbi
Master data visualization with our tutorial on creating a Stacked Waterfall Chart in Excel! 📊
✨ Dive into step-by-step instructions and enhance your analysis skills.
Watch now:youtube.com/watch?v=efMDkW…i
#Excel #WaterfallChart #DataViz