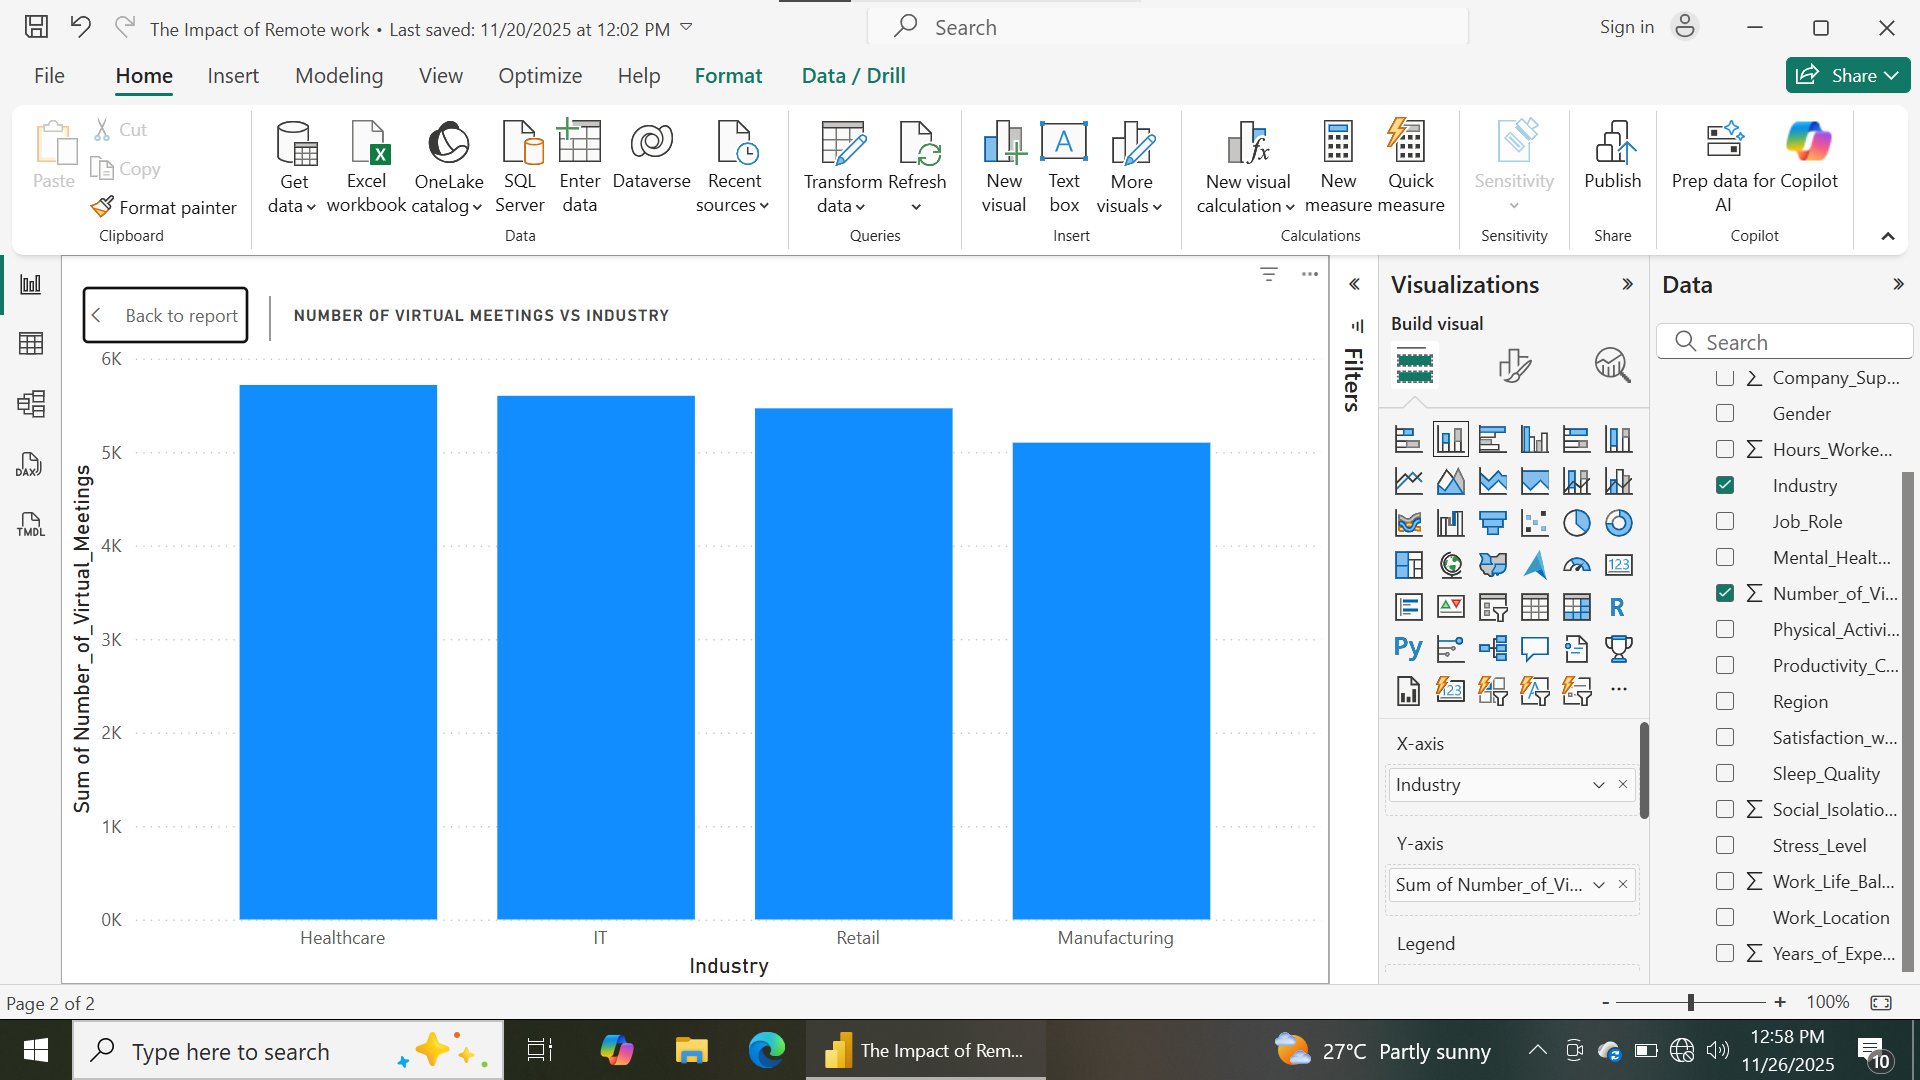
Using a Bi visualization tool..
My data analysis journey continues!
If you have any challenge with your dashboard you can reach out let's figure it out together 🥰
#Dataanalysis
#datavisualizatio
#powerbi
#letslearntogether�b8
1
44
Most dashboards don’t fail because of bad data. They fail because they ignore how the human brain actually processes visuals. If your charts fight human psychology, leaders hesitate. If your visuals...
From linkedin.com
How to Create a Waterfall Chart in Excel? Stepwise guide, benefits, challenges, limitations, tips of create waterfall chart and examples.
From analyticsvidhya.com