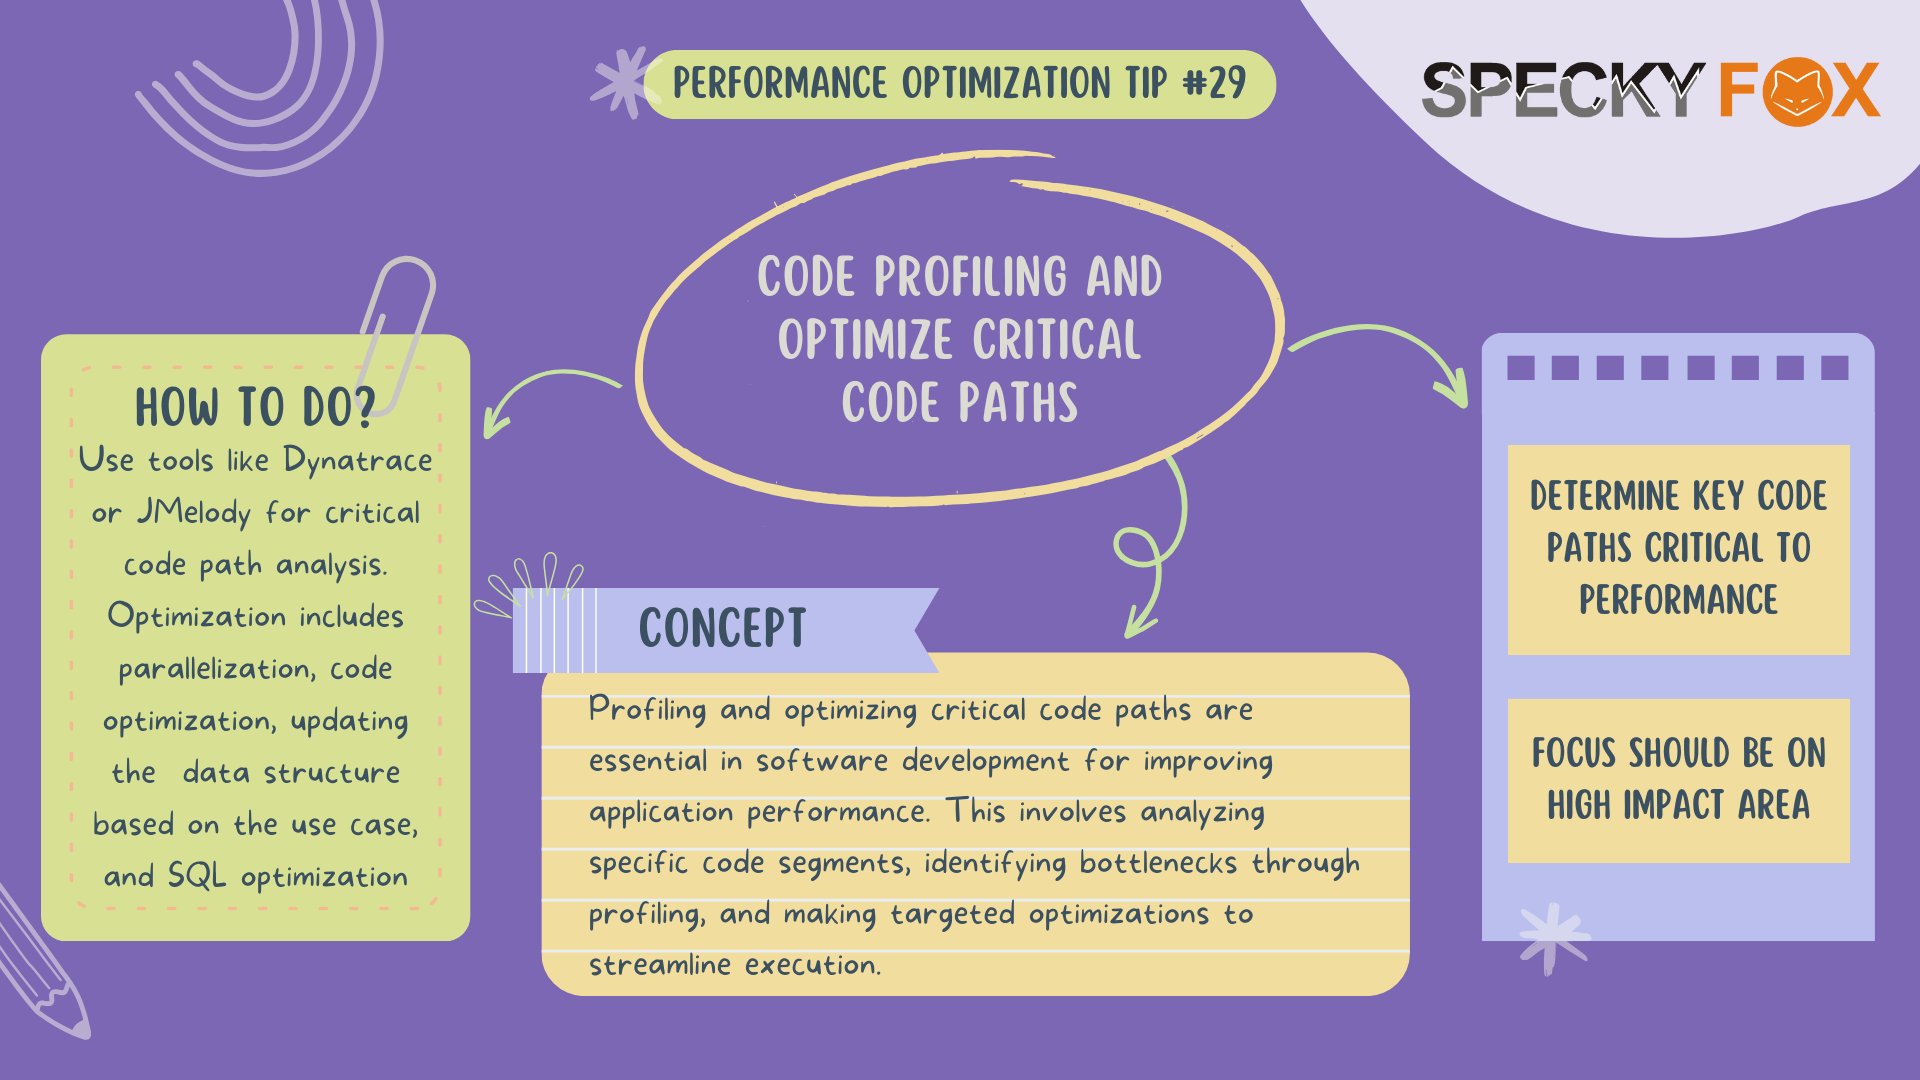
Profile Your Code. Use JAX + XLA with TensorBoard to debug. Run profilers to find hotspots in TPU jobs. Fix performance issues in your LLM code by analyzing traces and visuals. Essential for real-world tweaks. 📉 #ProfilingTools
9
The benefits of profiling when performance tests aren’t enough.
From thenewstack.io