2
458
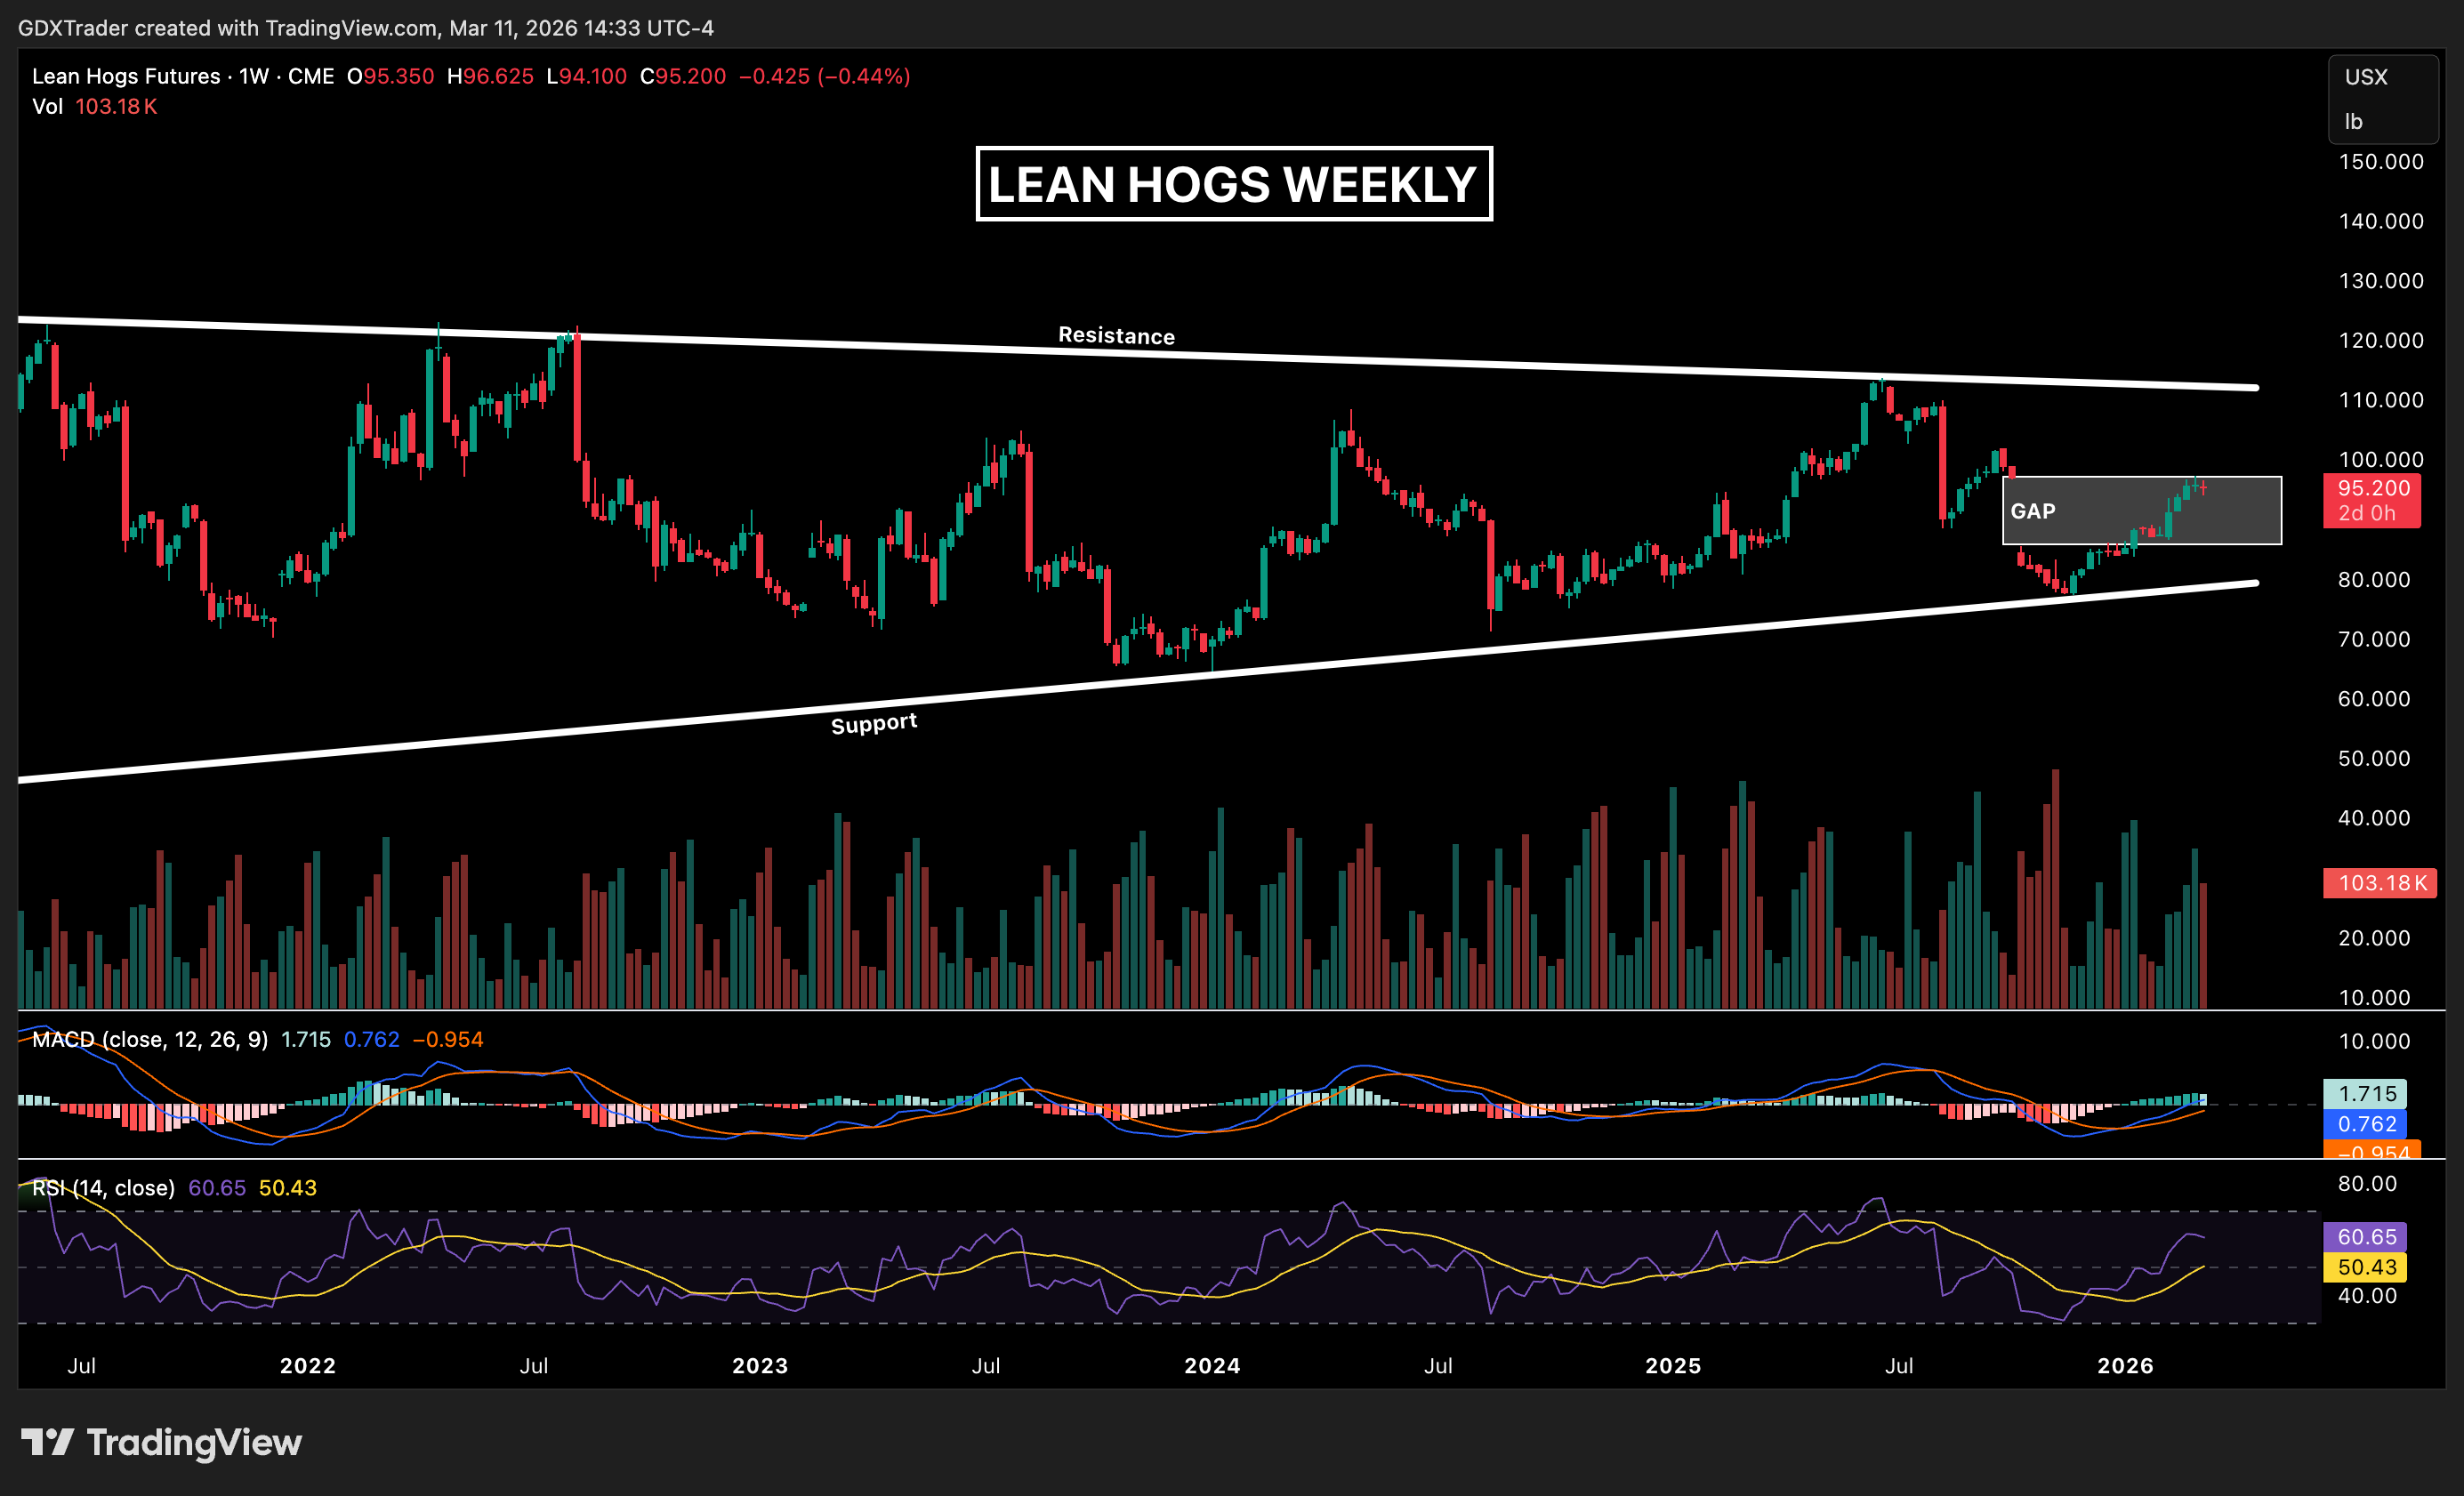
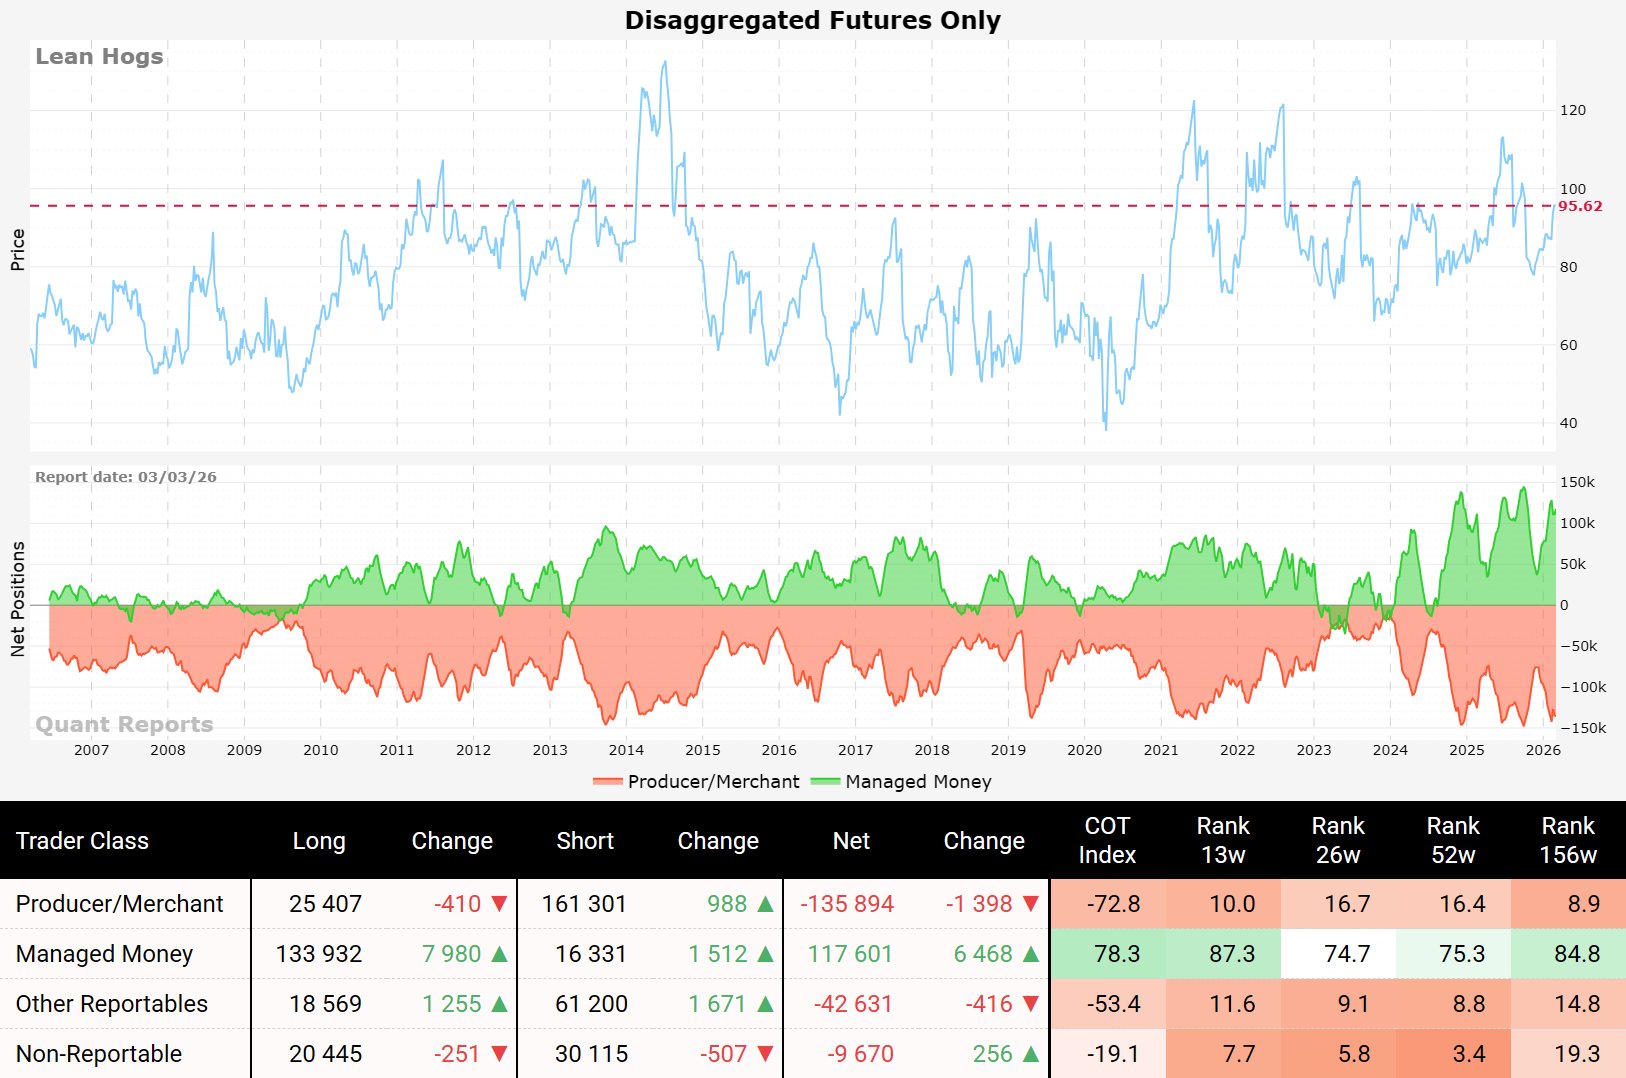
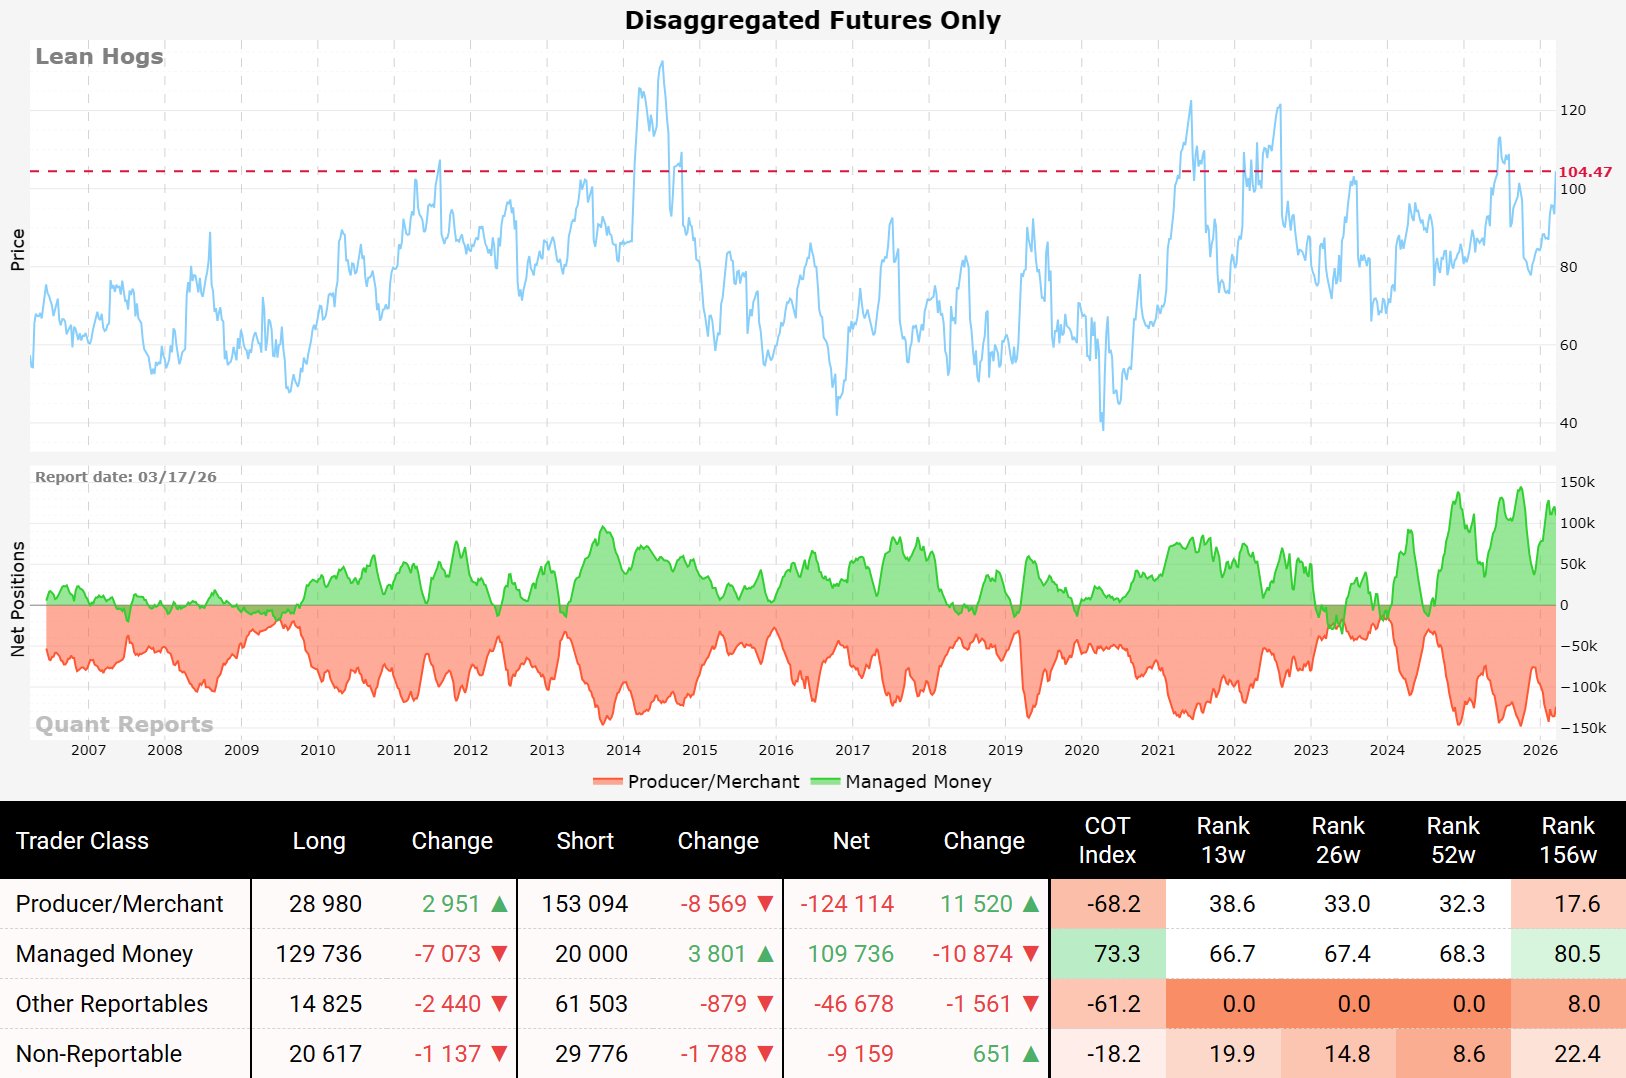
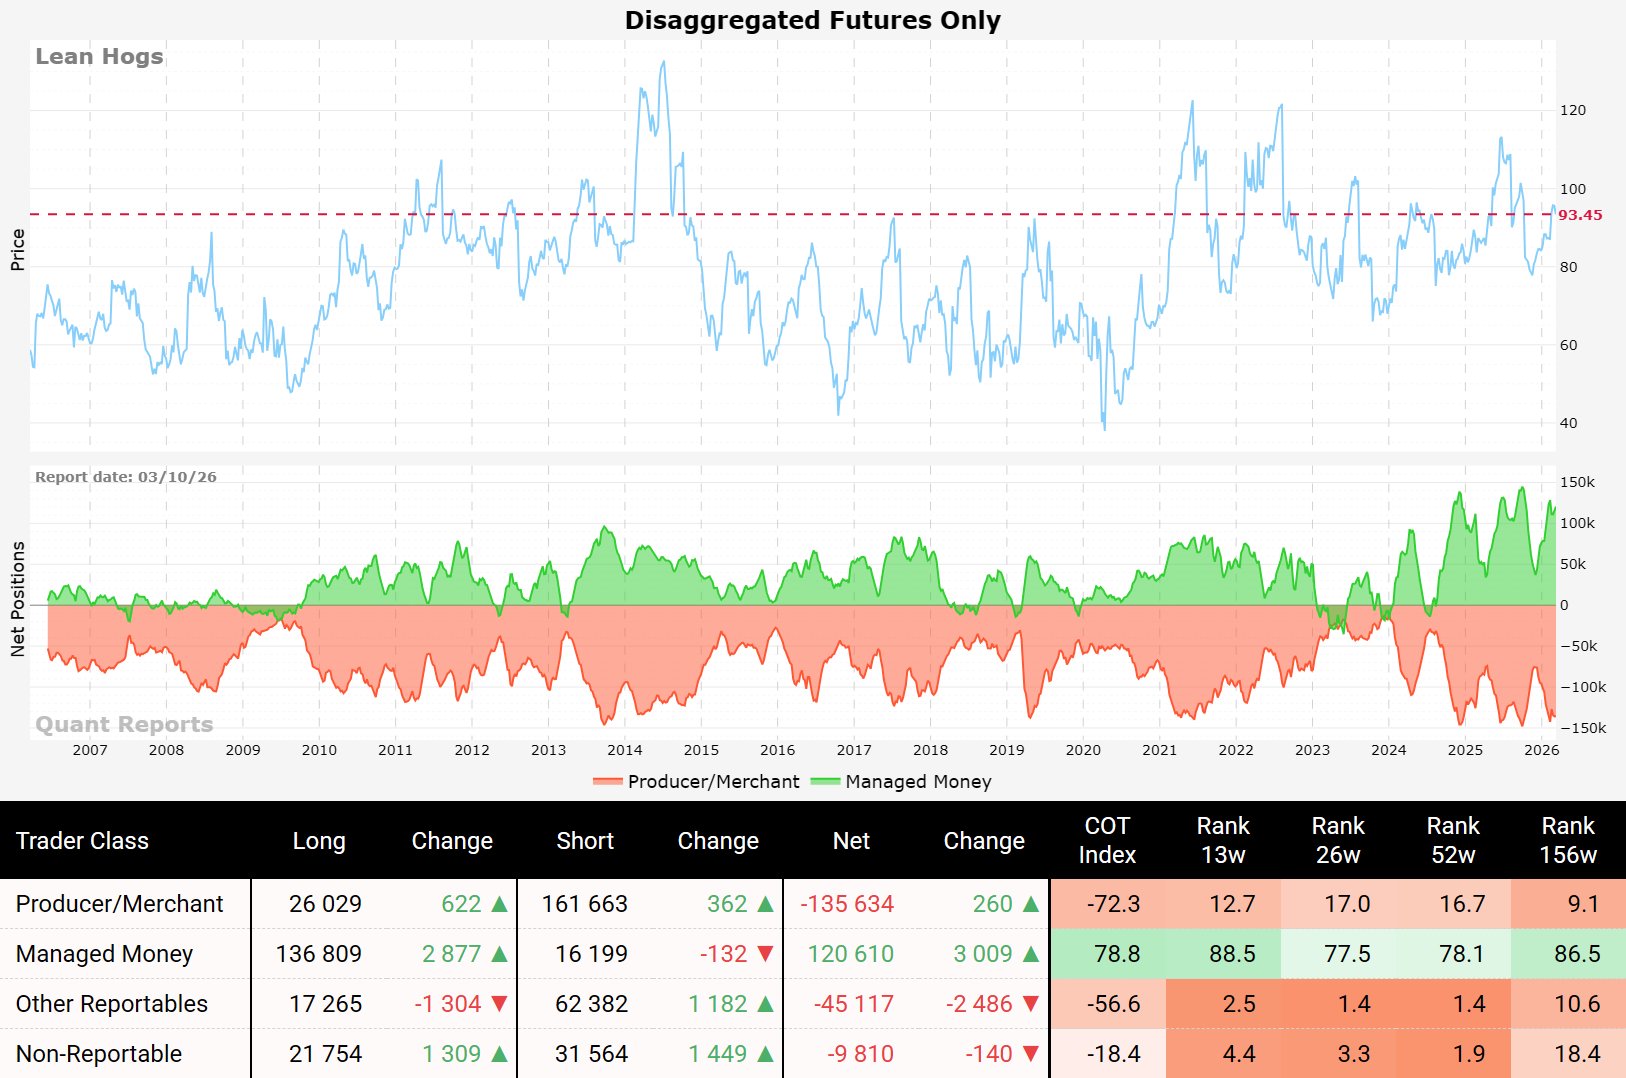
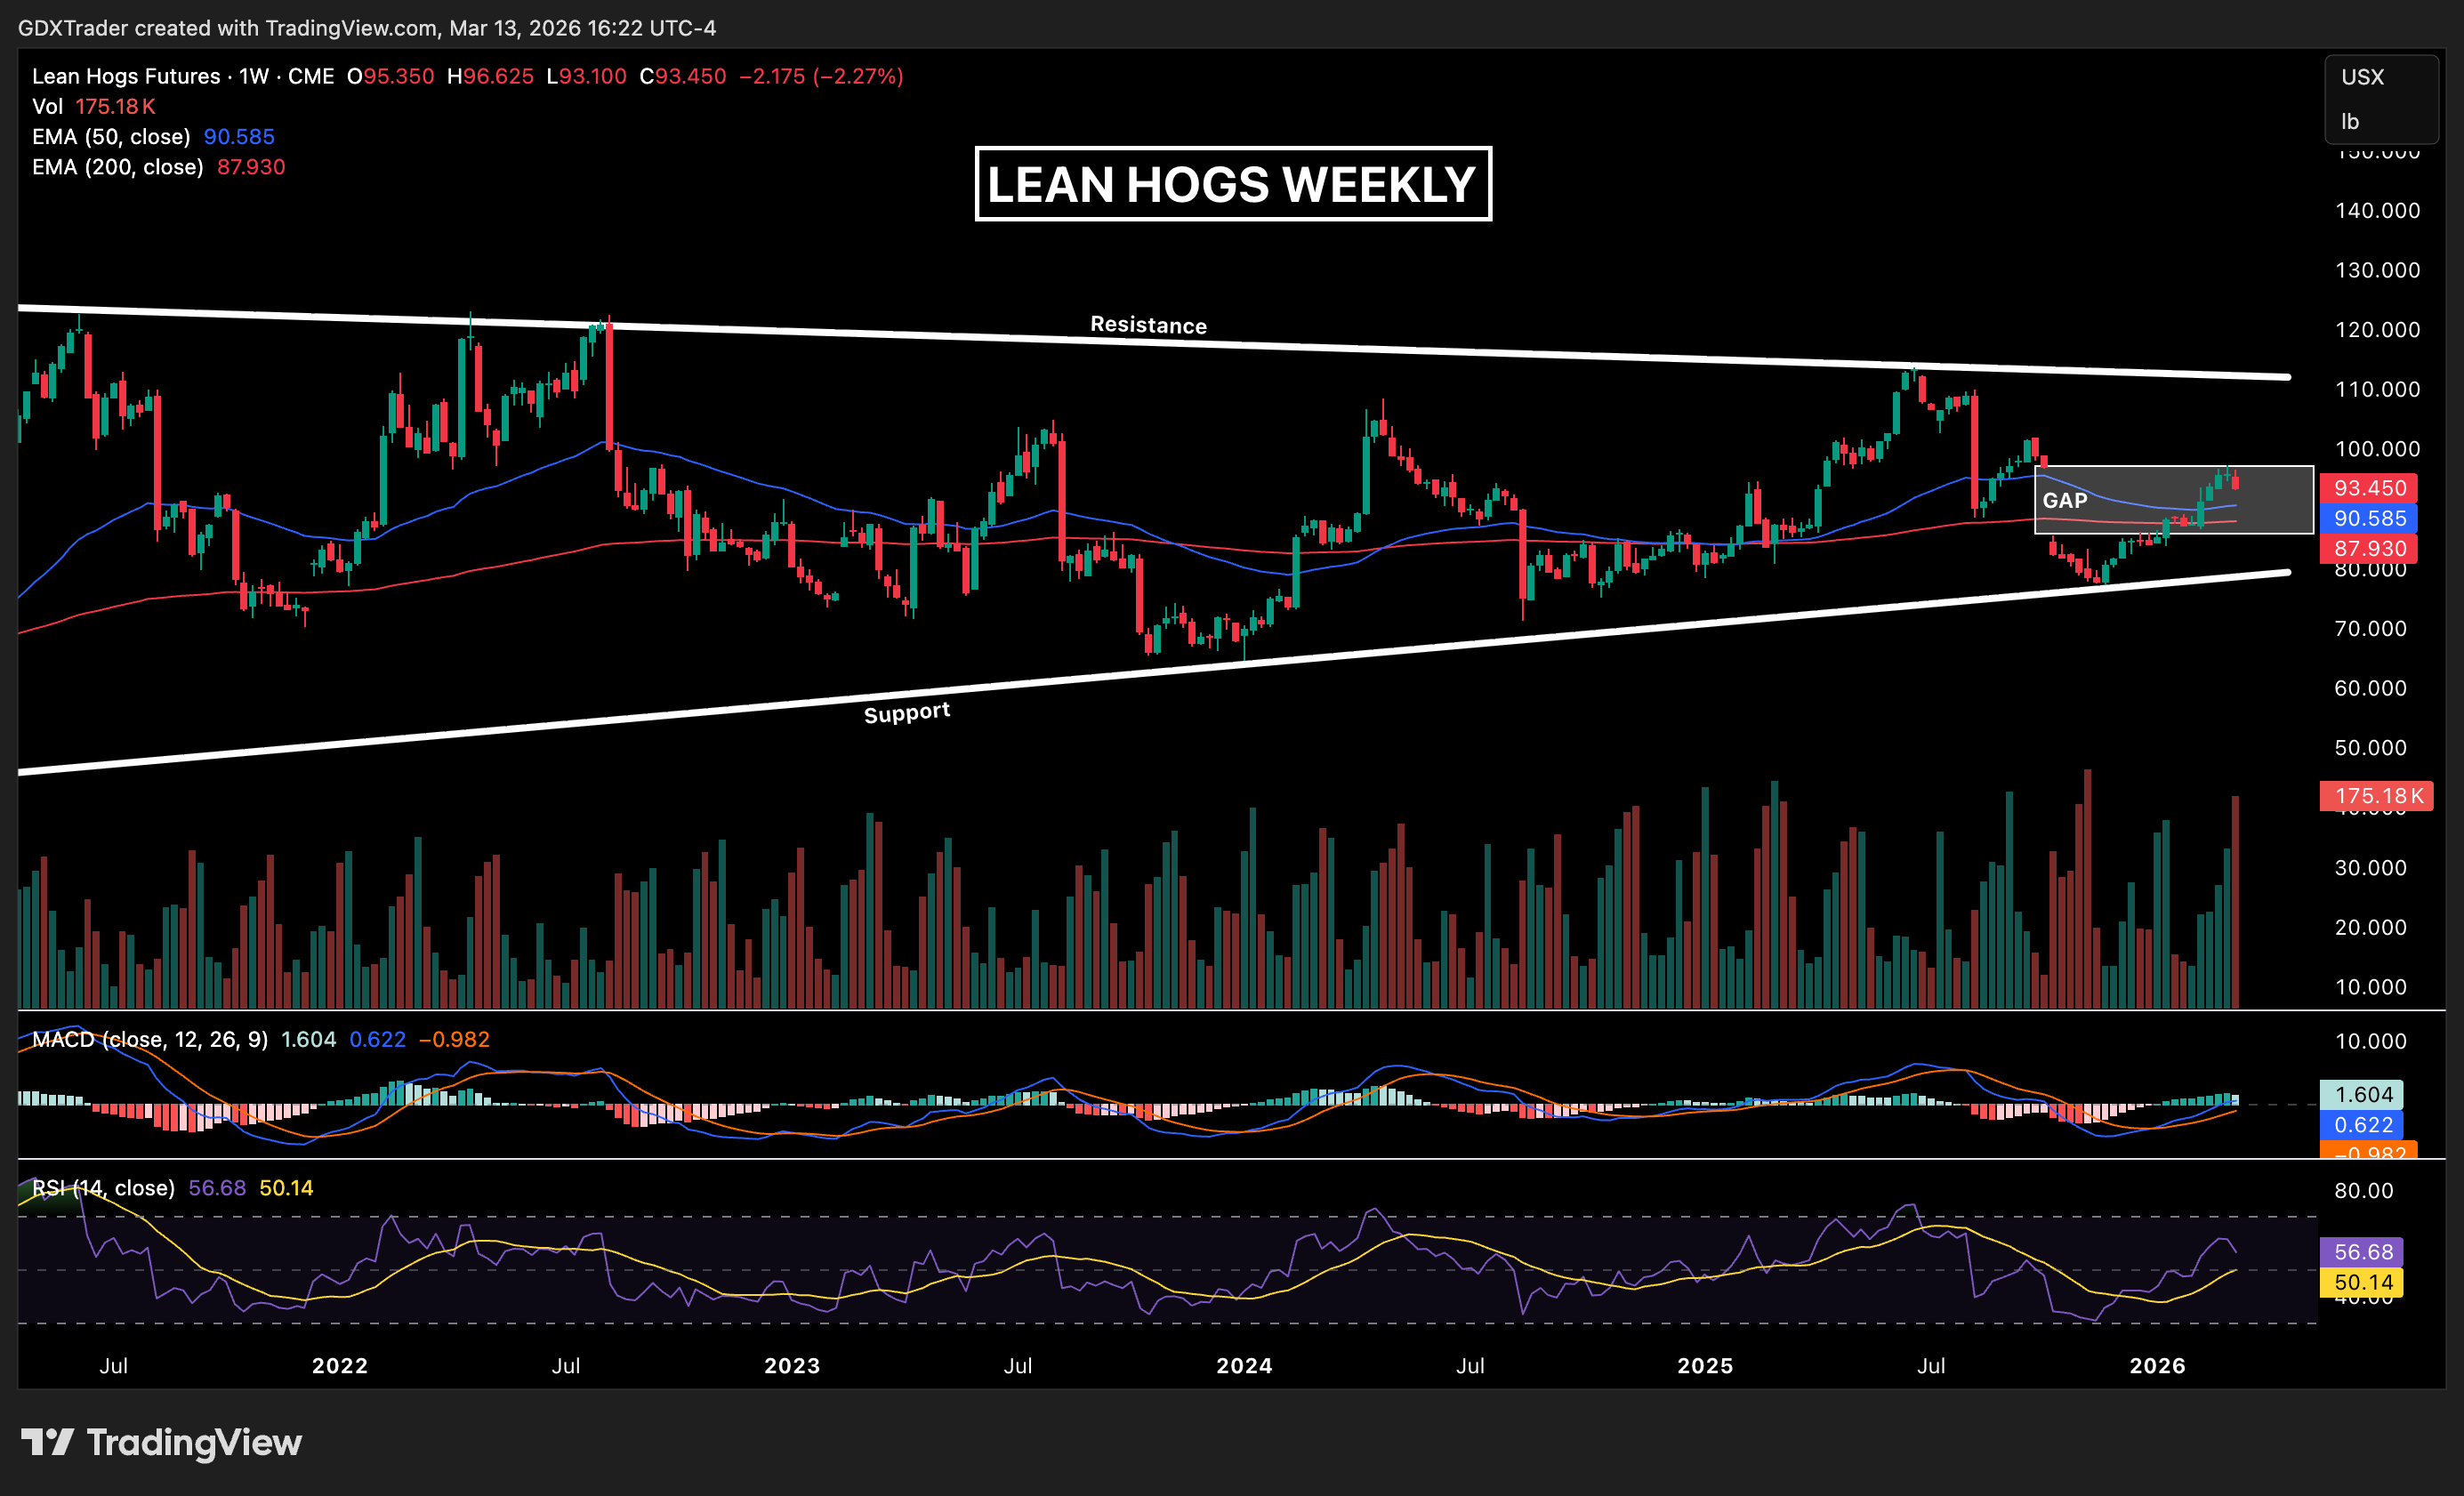
De sterke korte termijn stijging van LEAN HOGS roept enigszins twijfels op over de lichte bearish basis trend. Een trendomkeer is waarschijnlijk. Zolang de...
From centralcharts.com
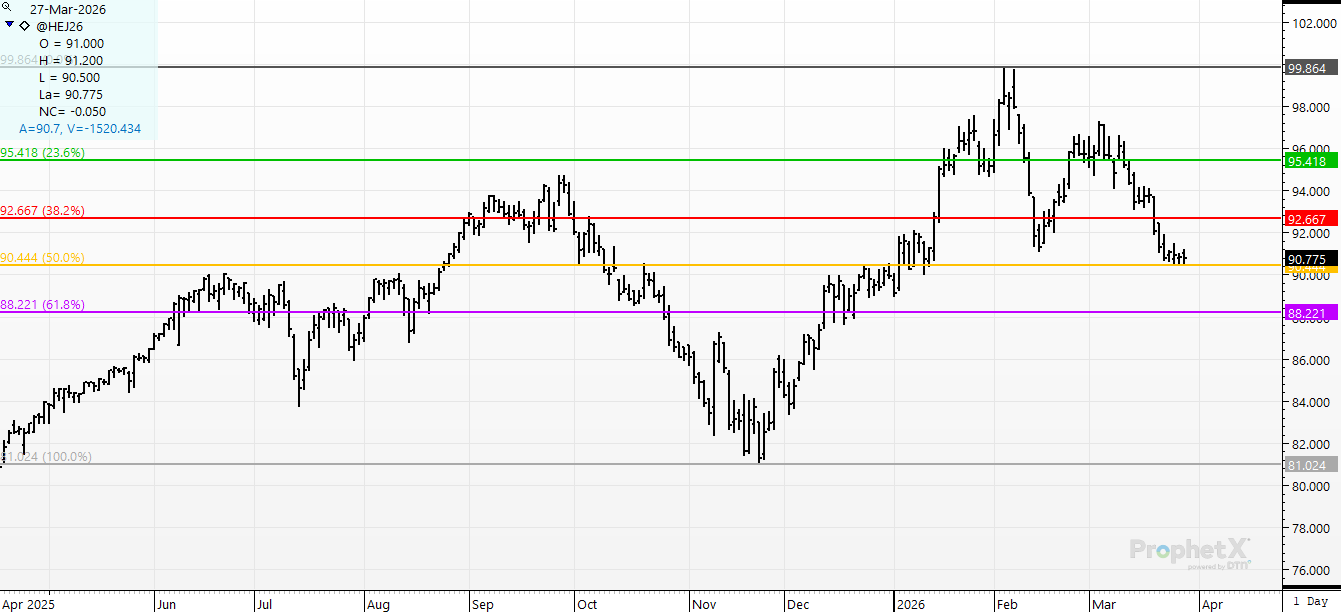
LEAN HOGS folgt einem sehr starken bärischen Trend. Trader könnten erwägen, nur Short-Positionen (Verkauf) zu traden, solange der Kurs klar unter bleibt. Die...
From centralcharts.com
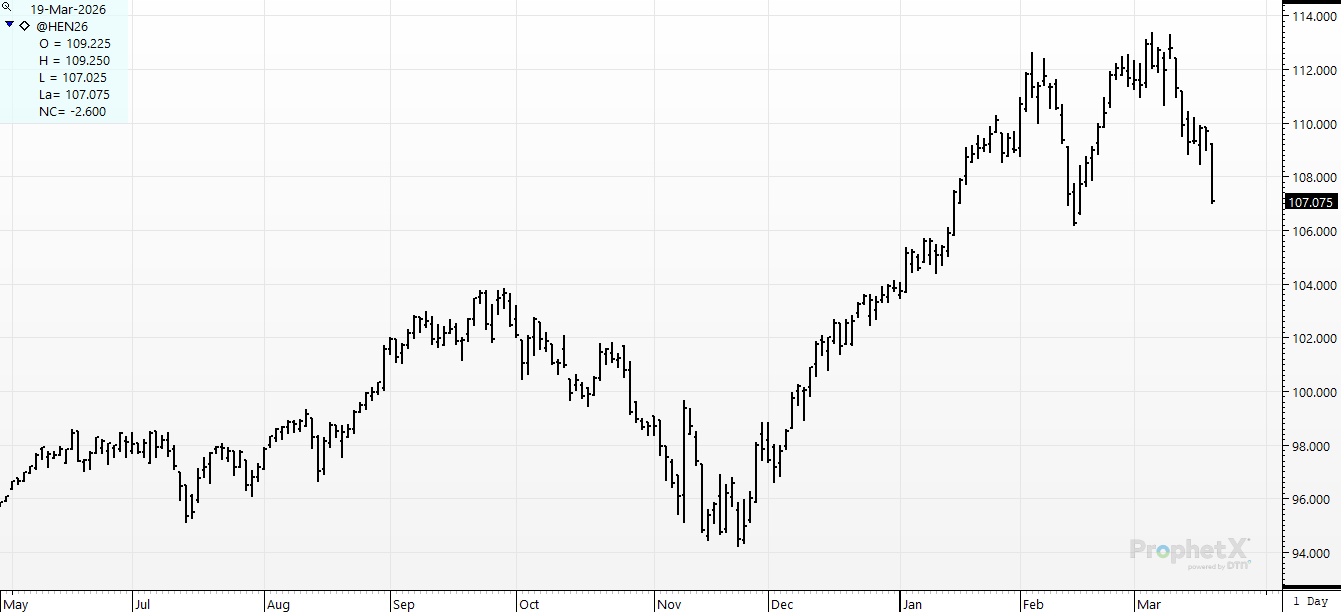
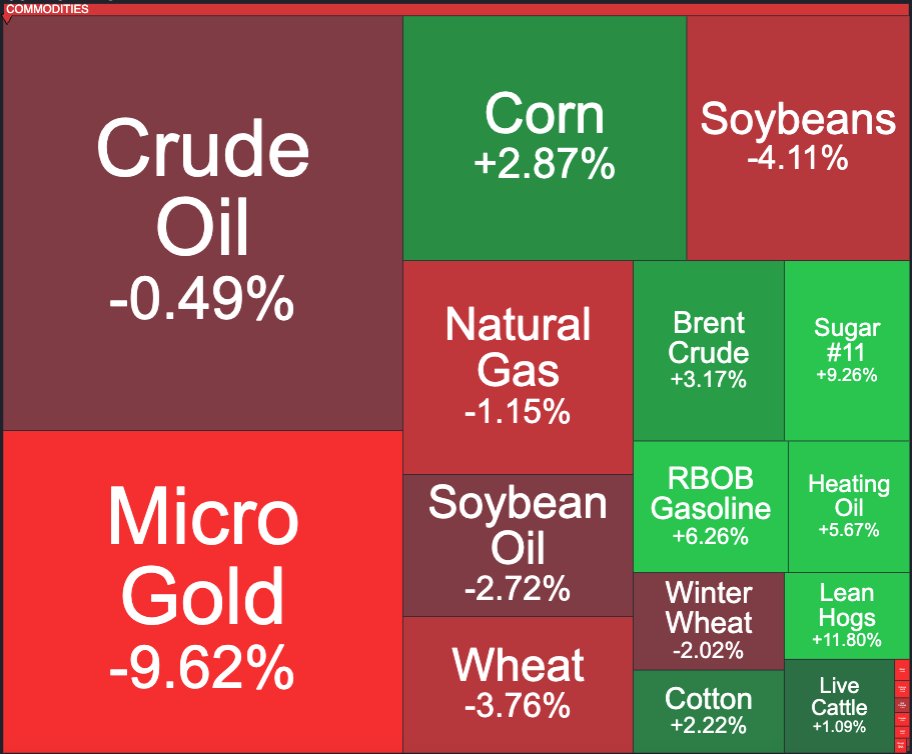
Markets continue to trade in tandem with the energy complex, keeping shorter term opportunities plentiful. These are the levels to watch for the last trading day of the week.
From bluelinefutures.com