I’m always open to learning, collaborating, and connecting with creative thinkers, data enthusiasts, and mentors who believe in the power of visuals and information.
Let’s connect and share ideas!
#techcrush#techsavvy#DataAnalys
What's your go-to tool for creating impactful visuals?
Personally, I love Power BI more than Tableau, but it lacks a native macOS version. As a big Apple fan, I use Power BI at work and Tableau on my personal MacBook.
#dataanalys#tableau#powerbi
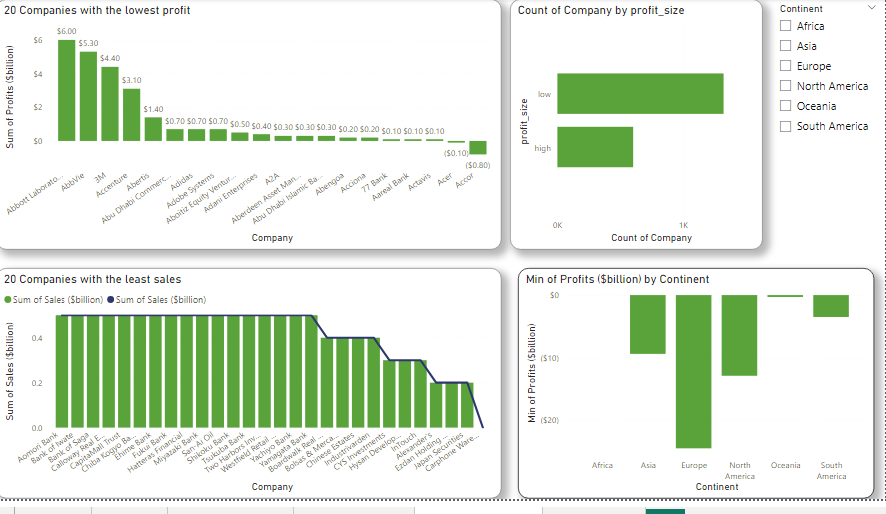
Day 3 of my BI challenge
Data source: kaggle
Dataset: Top 2000 companies globally in year 2020
Today's focus was on Companies with the lowest sales & profit
Made use of Column charts to visualize and slicers to drill down into the data by continent and
#powerbi#dataanalys
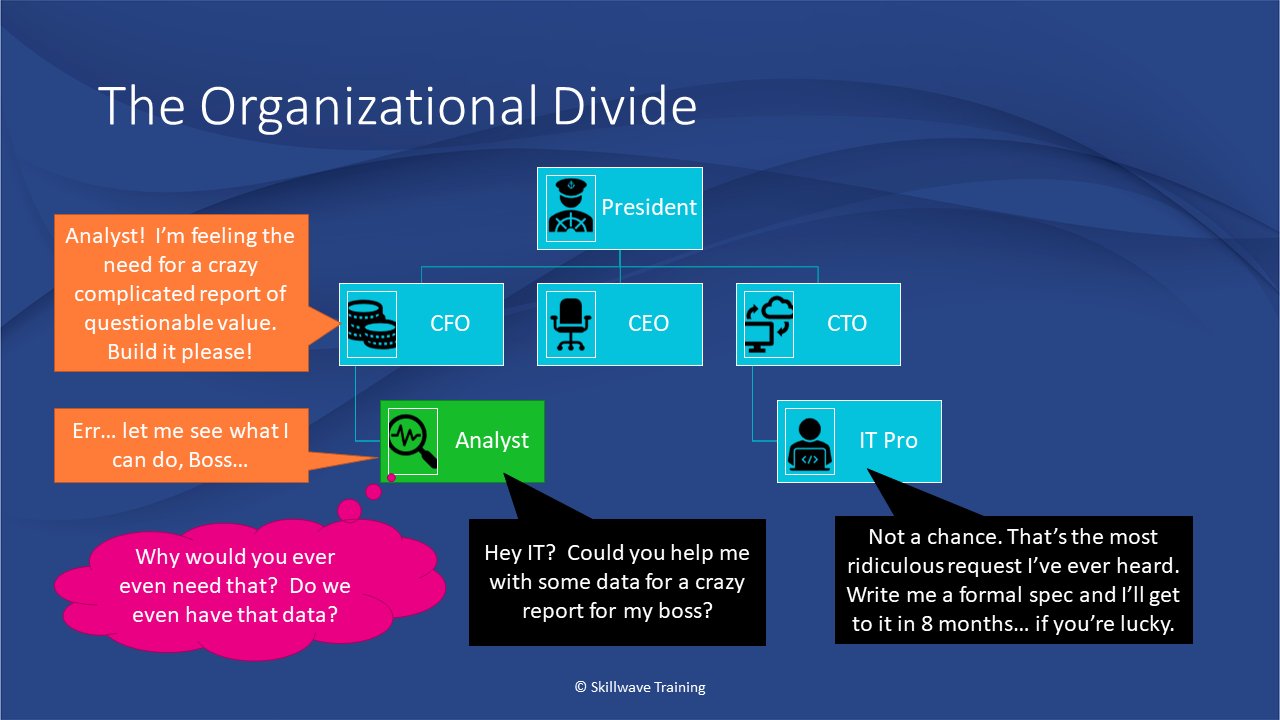
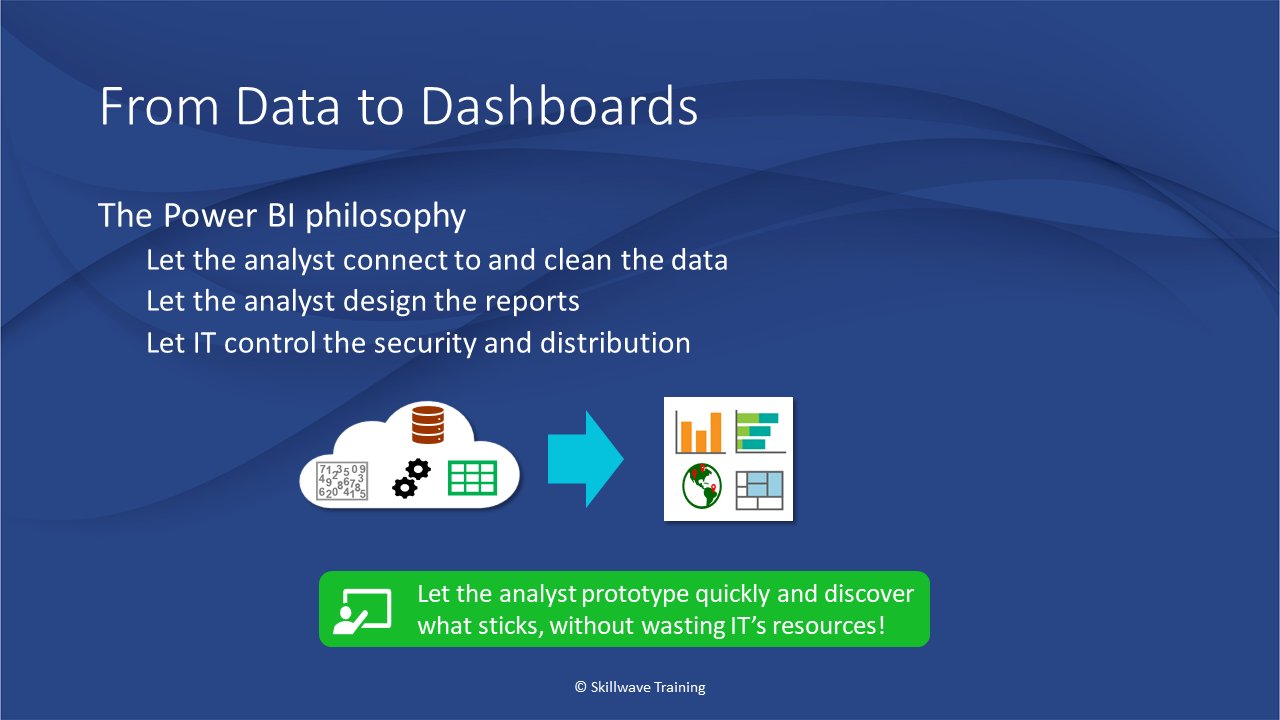
I'm having a great time today teaching for @cpa_bc, showing how you can use #PowerBI Desktop for rapidly building and sharing dashboards and reports. Ever been in a situation like this? Power BI lets the #DataAnalys prototype the report without wasting IT's resources!