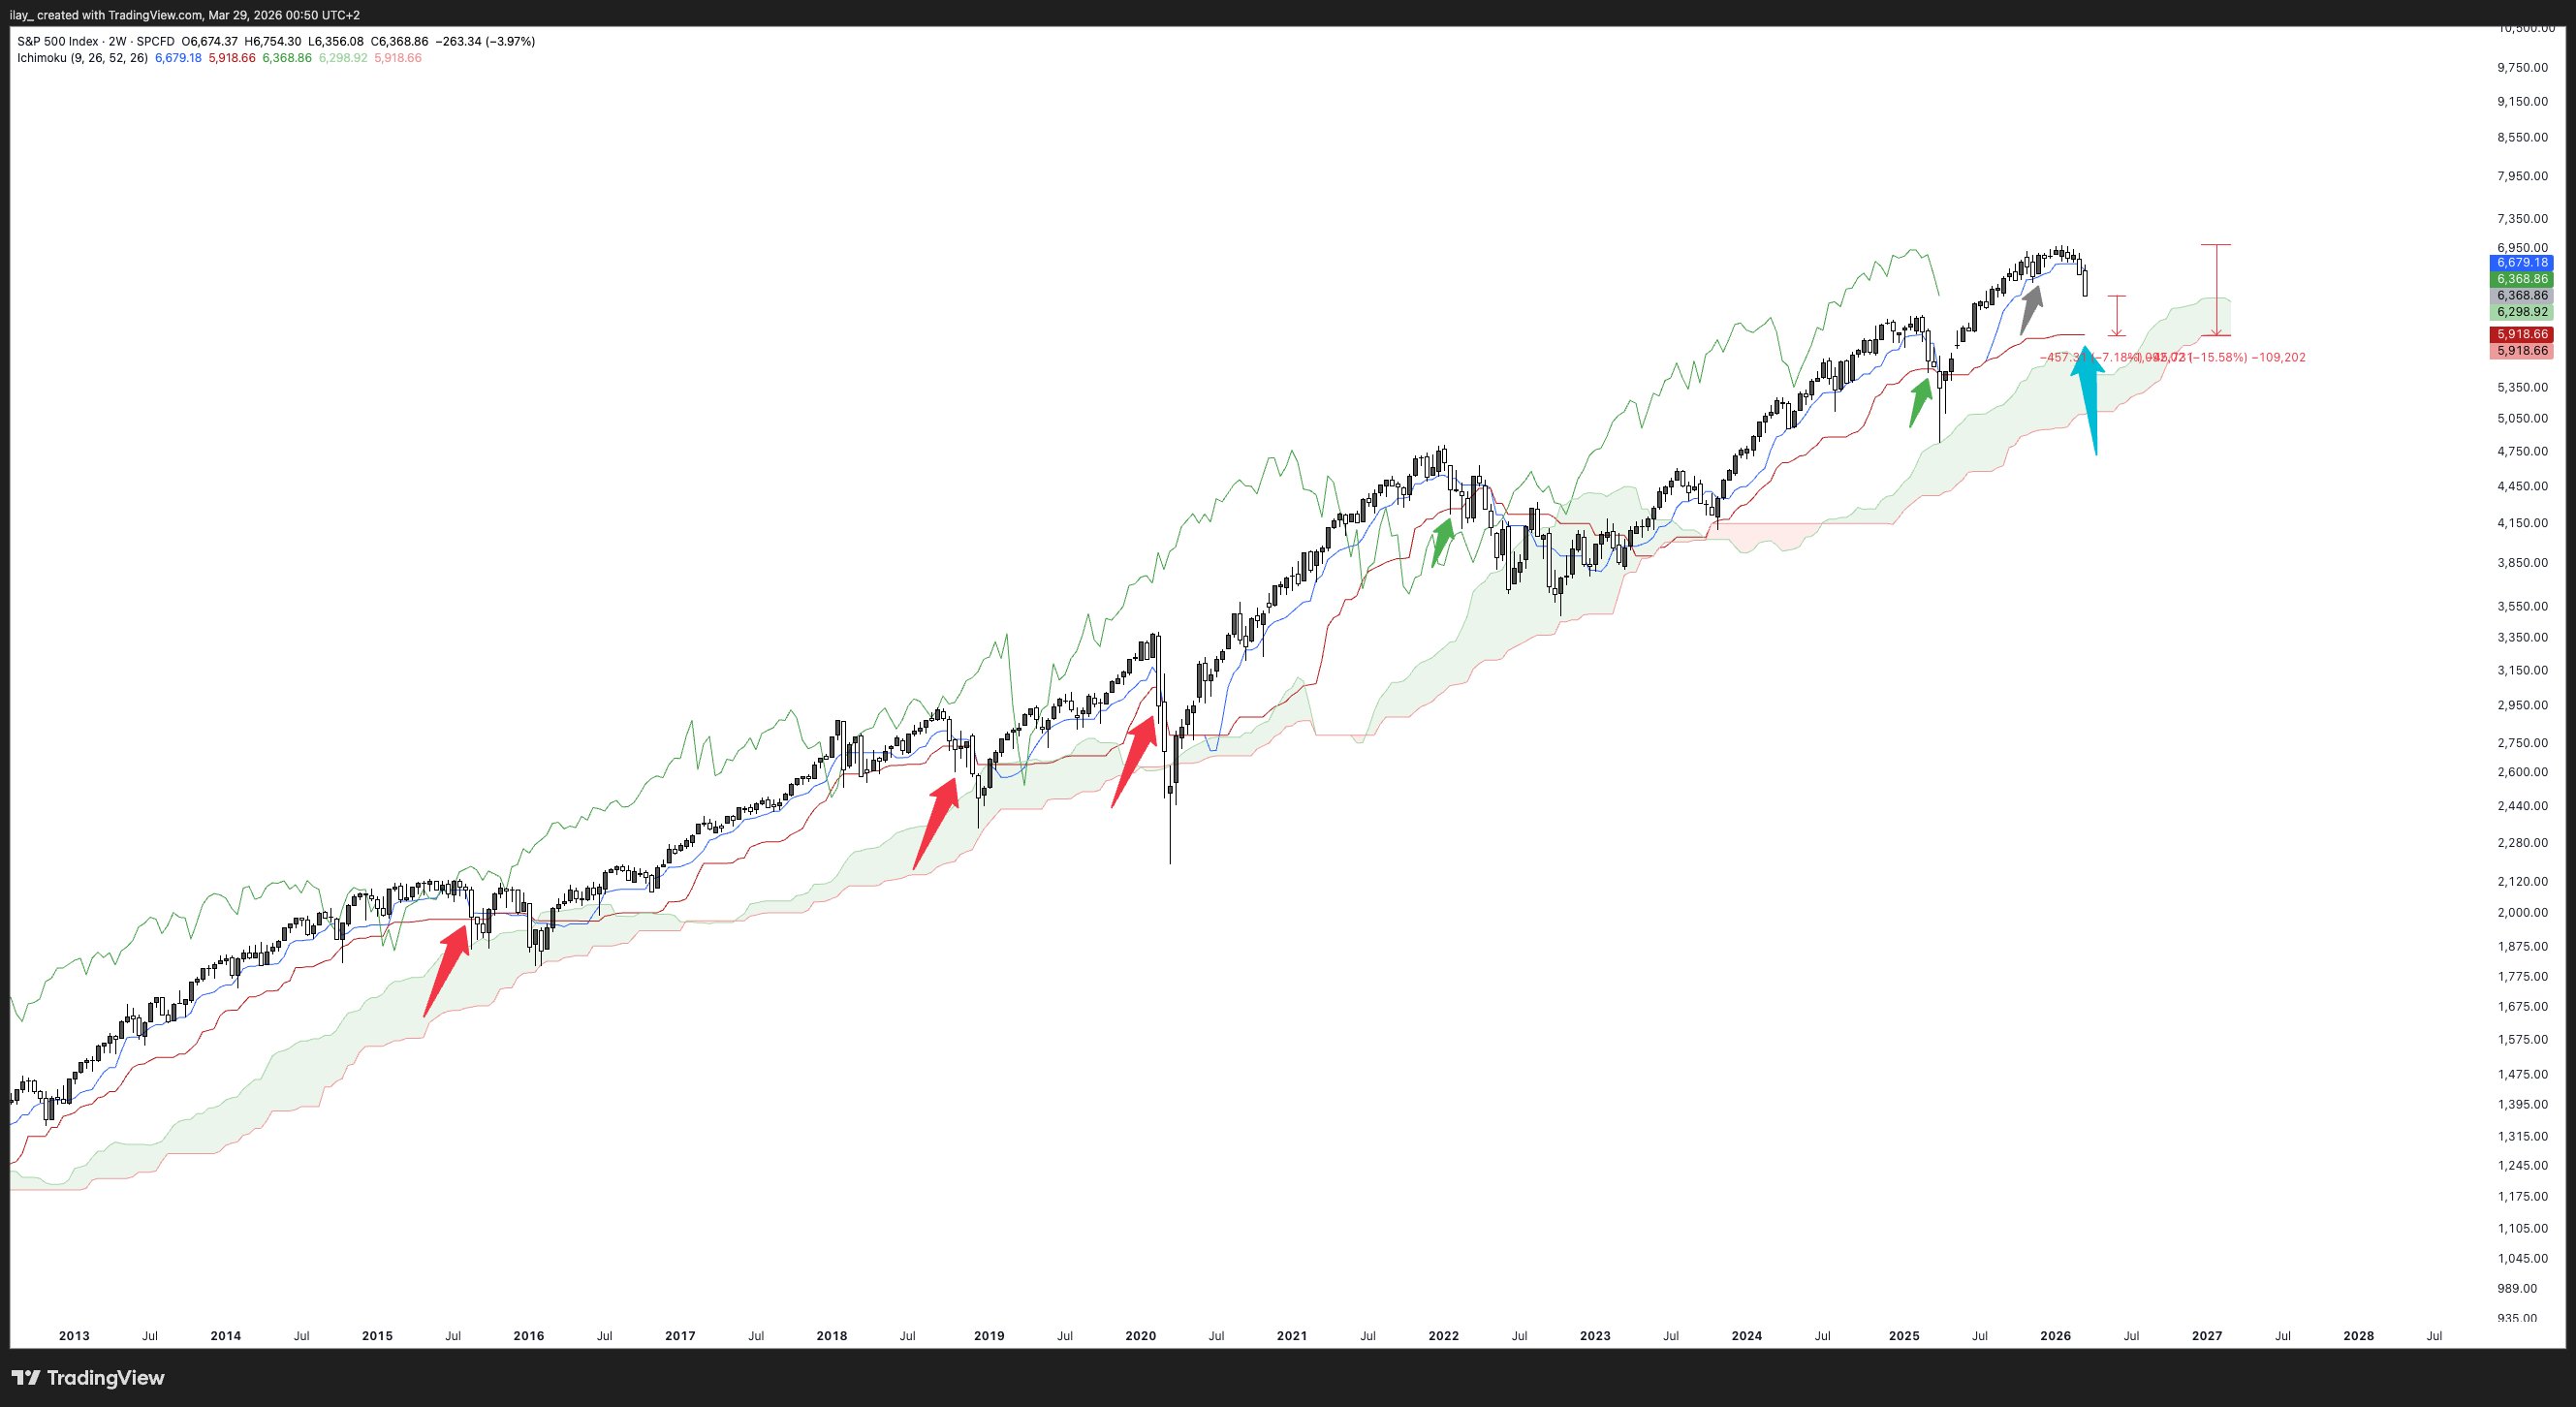
I’ve mapped out 5 historical cases on this SPX (S&P500) chart (excluding the current setup) over the last 13 years where we saw a Chikou Span (CS) bearish cross on the 3D timeframe. Meaning the CS sliced cleanly through both the Tenkan and Kijun (grey arrows). In Ichimoku, this is a
Look at the subsequent Price Action (red and green arrows). After tapping the 3D 100MA, the index failed to hold the line and dipped in 3 out of those 5 cases. In the remaining 2 cases, we got a bounce (a Lower High relief rally)
SPX is sitting right on this exact moment as we speak. This is only the 6th occurrence in 13 years. There is still a case for SPX holding support here, as the chart is currently mirroring the 2025 correction structure
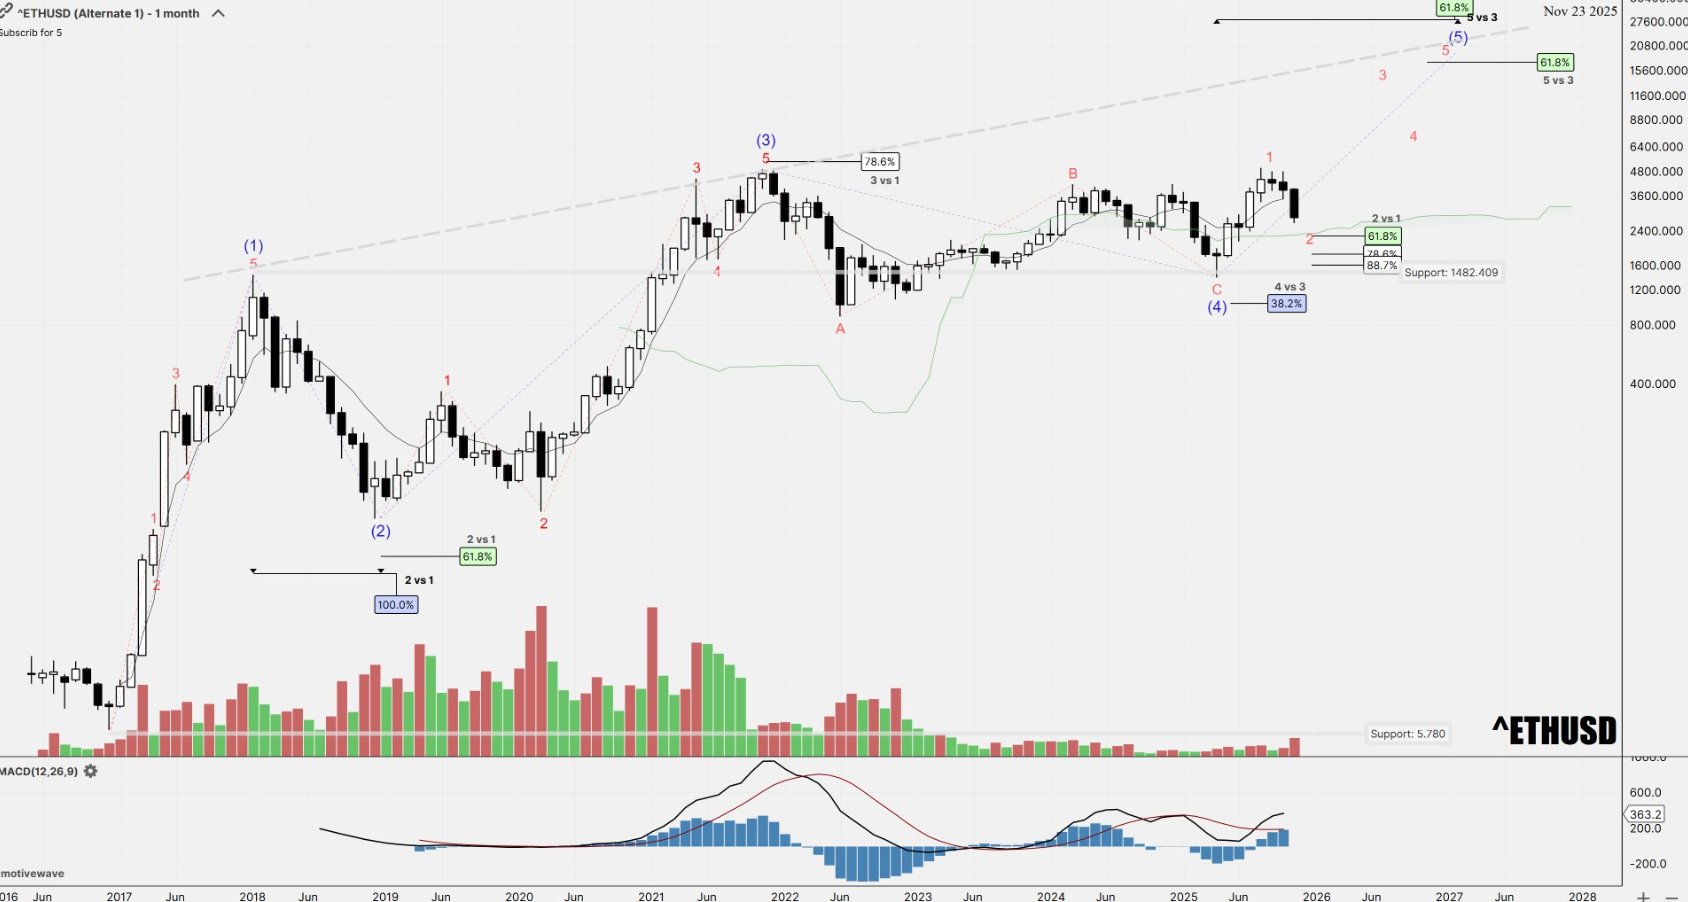
But you need to be fully aware of the historical weight of this setup. Should SPX fail to hold this level and break lower, it will inevitably drag the crypto market down with it