#Bitcoin interesting comparison with the 2019 Bottom below from Orion.
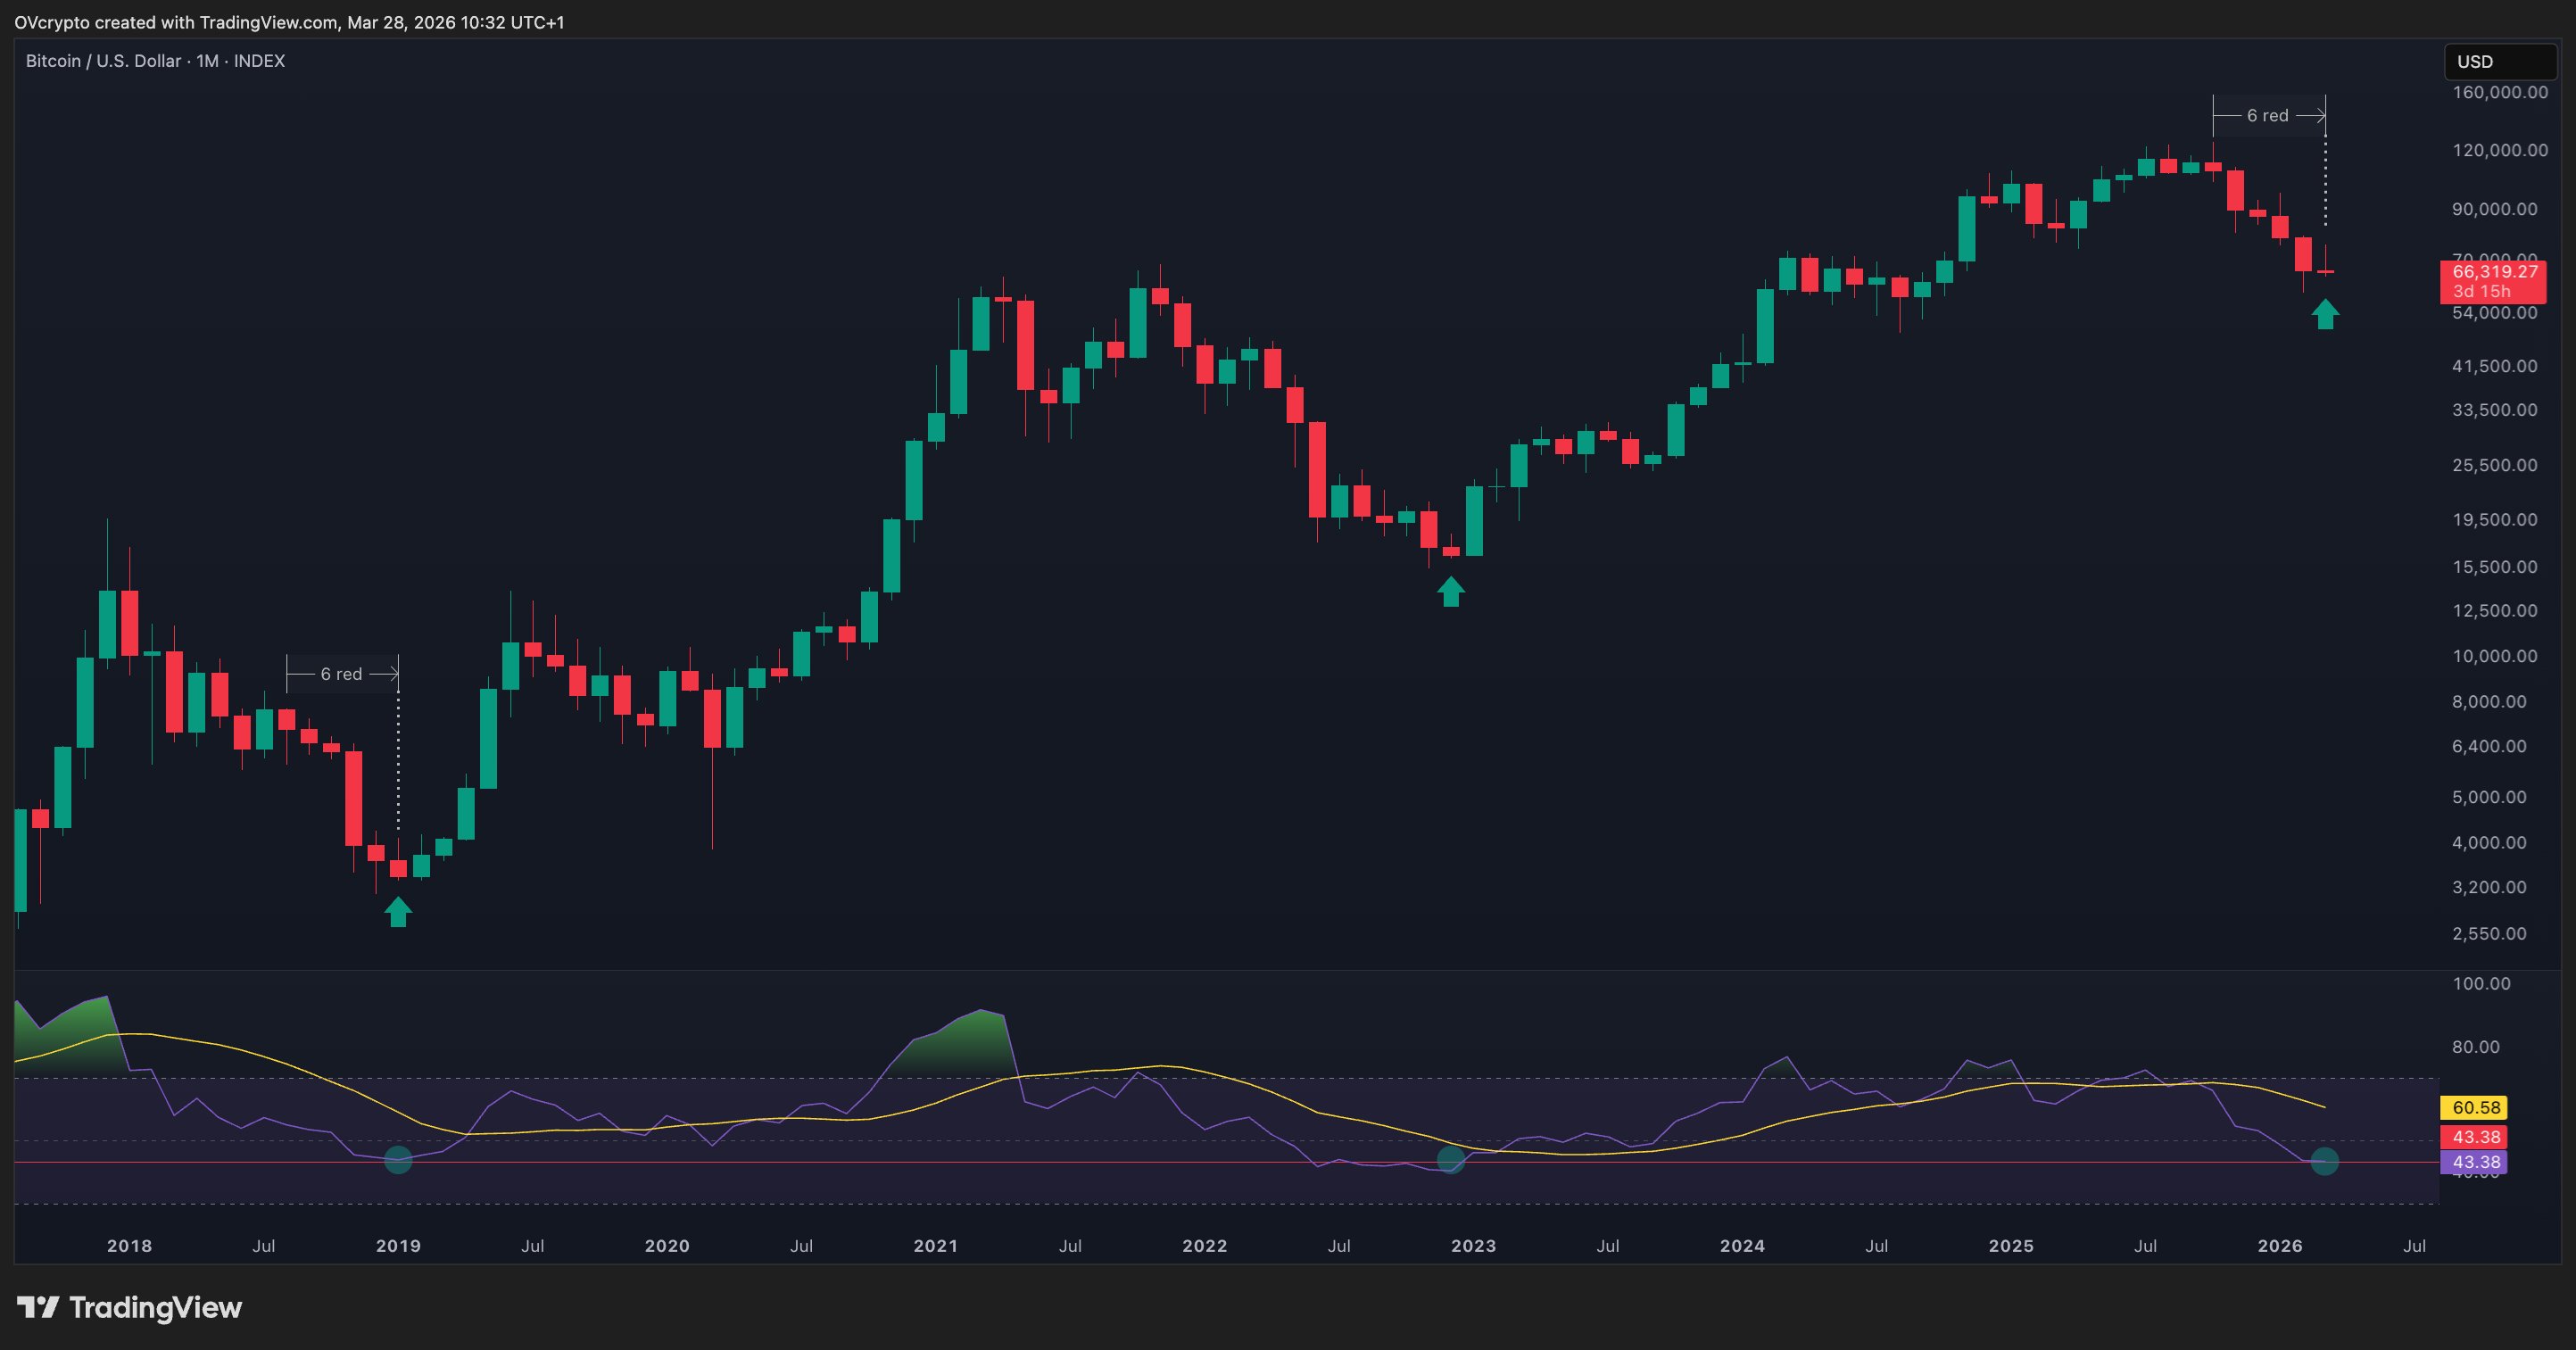
Also looking at the BTC monthly chart, we have a monthly close in few days, but so far we are having 6 red months in a row (like 2019), the candlestick could be shaping similarly to 2019 (and 2022 btw) and the 40 area.
At the end it looks like there will be no push, until we get some kind of resolution in all this world uncertainty and with a weak stock market too.
Enjoy your weekend away from the charts!
The 2018-2019 flash crash bottom remains the highest score analog when backtesting the 1Y range.
#BTC’s bottoms don’t always have to draw out for months of chop. This is why it’s helpful to narrow the search by macro backdrop.
If you do so, you’ll see that today’s environment resembles 2019, which favors a quick recovery for #Bitcoin.
16 Likes 1 Bookmarks
3
16
983